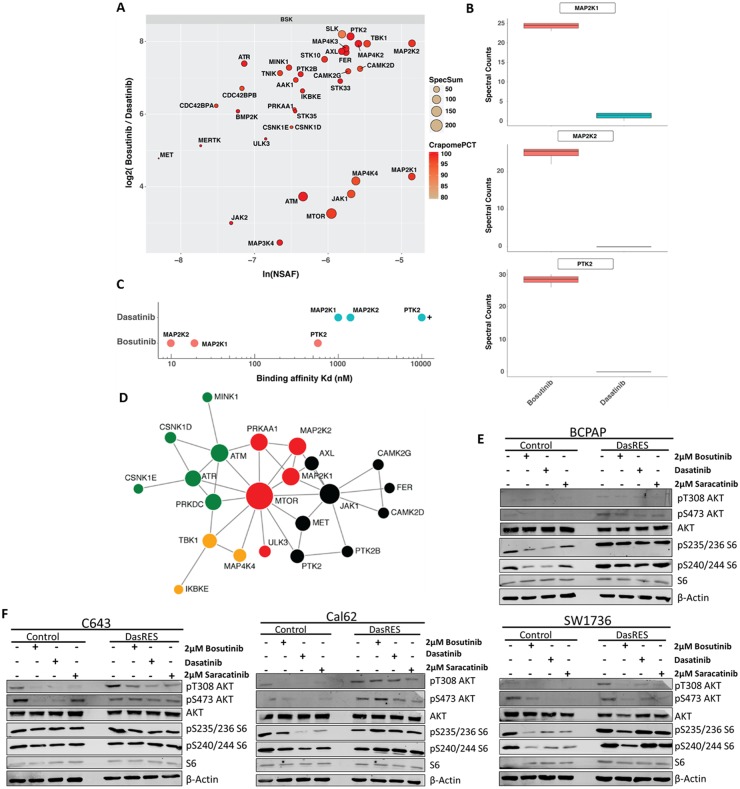
Figure 2. Bosutinib-specific kinase targets in BCPAP cells.
(A) Protein kinase interaction profile of bosutinib in BCPAP-DasRes cells as determined by NSAF and ratio of spectral counts relative to dasatinib. NSAF: normalized spectral abundance factor; CRAPomePCT: percent probability of specific interaction based on CRAPome database. Displayed are kinases with SaintScore >= 0.8. (B) Box plots of spectral counts for MEK1, MEK2 and FAK based on bosutinib and dasatinib pull downs. (C) Visual representation of KD‘s of relative bosutinib and dasatinib binding for MEK1, MEK2 and FAK. (D) STRING map of protein-protein interactions of the bosutinib specific kinases. Colors represent individual modules. Size represents eigenvector centrality. (E-F) BRAF-mutant (E) and Ras-mutant (F) control and DasRes cells were treated with the indicated inhibitors for 24 hours. Cell lysate was harvested and a Western blot was performed to determine changes in downstream targets of the AKT/mTOR (AKT, S6) and MEK (ERK) pathways. Three independent biological replicates were performed, and representative blots for signaling proteins and loading controls are shown. Control cells were treated with 100nM dasatinib, and DasRes cells were treated with 2μM dasatinib.

