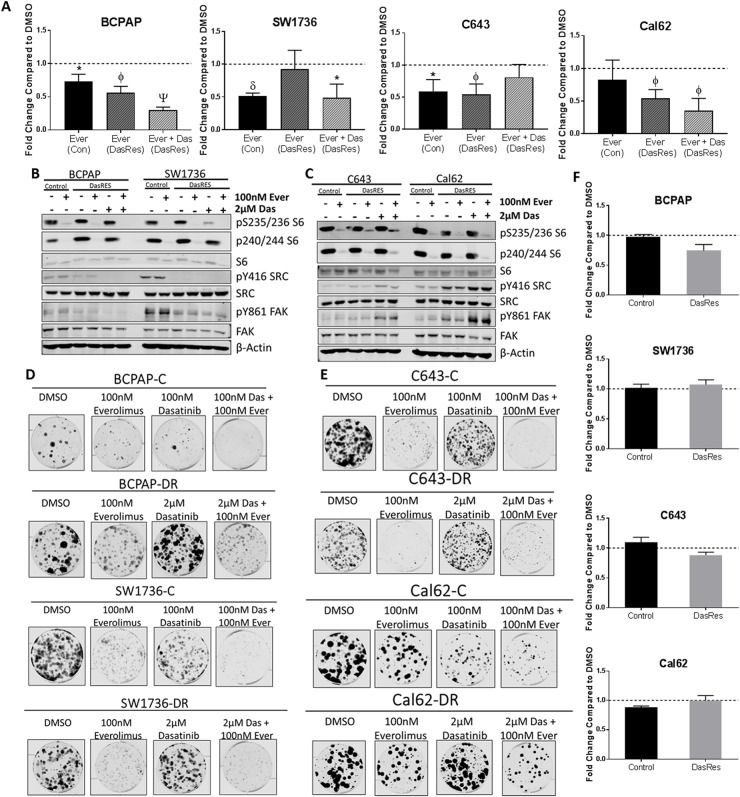
Figure 3. The mTOR inhibitor, everolimus, inhibits cell growth and clonogenicity, but does not induce apoptosis.
(A) Cells were treated with DMSO or Everolimus for 72 hours, and cell number was counted using the ViCell Cell Counter. Fold changes are compared to DMSO. Three independent biological replicates were performed, and the standard error mean is displayed in the quantification graphs. p-value * = 0.05 – 0.01, φ = 0.01 – 0.001, δ = 0.001 – 0.001, Ψ < 0.0001. (B-C) BRAF-mutant (B) and RAS-mutant (C) control and DasRes cells were treated with the indicated inhibitors for 24 hours. Cell lysate was harvested and a Western blot was performed to determine changes in the AKT/mTOR pathway signaling. Control cells were treated with 100nM dasatinib, and DasRes cells were treated with 2μM dasatinib. Three independent biological replicates were performed, and representative blots for signaling proteins and loading controls are shown. The pY416 Src blot was stripped and reprobed for total Src. (D-E) BRAF-mutant (D) and Ras-mutant (E) control and DasRes cells were treated with the indicated inhibitors for 7 days, and then released for 7 days to assess colony growth after inhibitor treatment. After 2 weeks, cells were fixed and stained with crystal violet. (F) Apoptosis was measured after 24 hours of everolimus treatment by caspase 3/7 cleavage using the Caspase-Glo 3/7 kit. Fold changes were calculated by comparing treatments to DMSO. Three independent biological replicates were performed, and the standard error mean is displayed in the quantification graphs.

