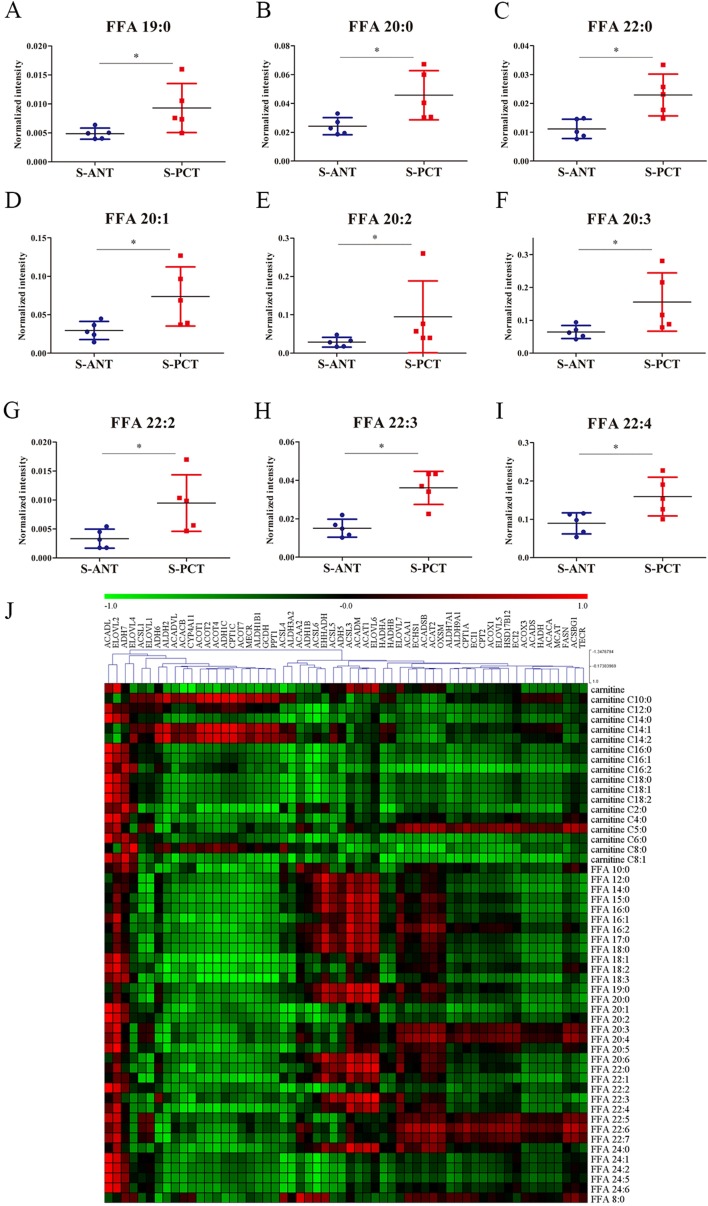
Figure 3. The alterations in fatty acid metabolic pathway in SPOP-mutated cohort.
(A–I) The normalized peak intensity values of FFA 19:0 (A), FFA 20:0 (B), FFA 22:0 (C), FFA 20:1 (D), FFA 20:2 (E), FFA 20:3 (F), FFA 22:2 (G), FFA 22:3 (H), FFA 22:4 (I) are shown. (J) Heatmap of PCC between 58 transcripts and 52 metabolites in fatty acid metabolic pathway. Each column represented a transcripts and each row represented a metabolites. *p < 0.05 compared with the ANT tissues. S-PCT, SPOP-mutated PCT tissues; S-ANT, SPOP-mutated ANT tissues.

