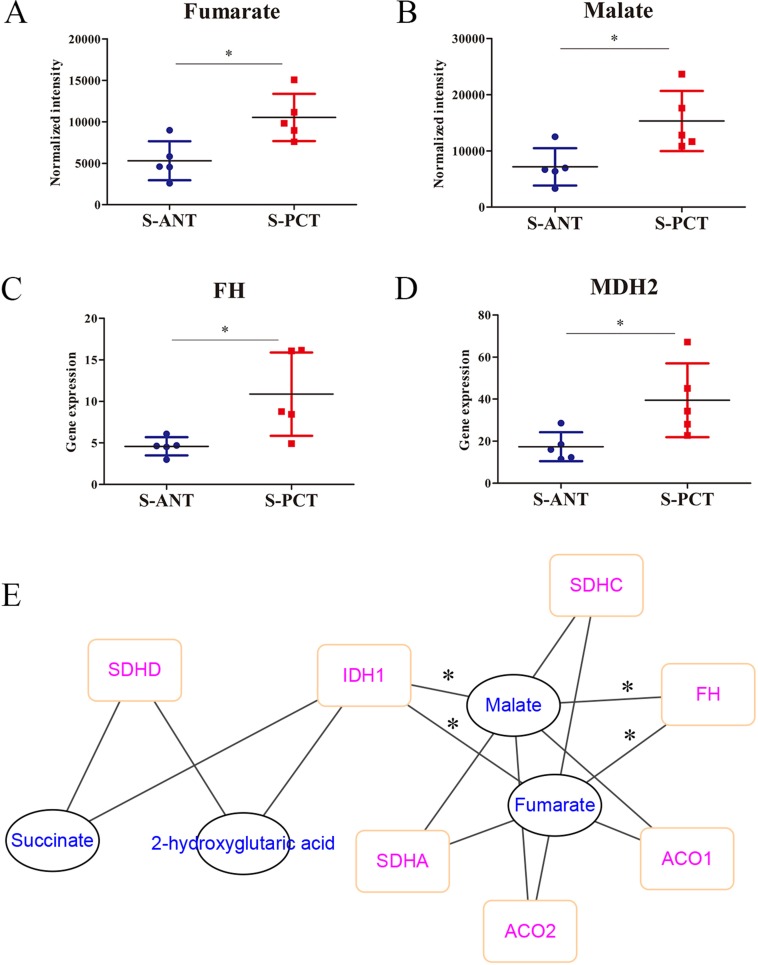
Figure 4. The alterations in TCA metabolic pathway in SPOP-mutated cohort.
(A–B) The normalized peak intensity values of fumarate (A) and malate (B). (C–D) The expression of FH (C) and MDH2 (D) transcripts. (E) A correlation network was constructed based on PCC between transcripts and metabolites in TCA cycle, with the absolute value of correlation coefficient more than 0.6. *p < 0.05 compared with the ANT tissues. S-PCT, SPOP-mutated PCT tissues; S-ANT, SPOP-mutated ANT tissues.

