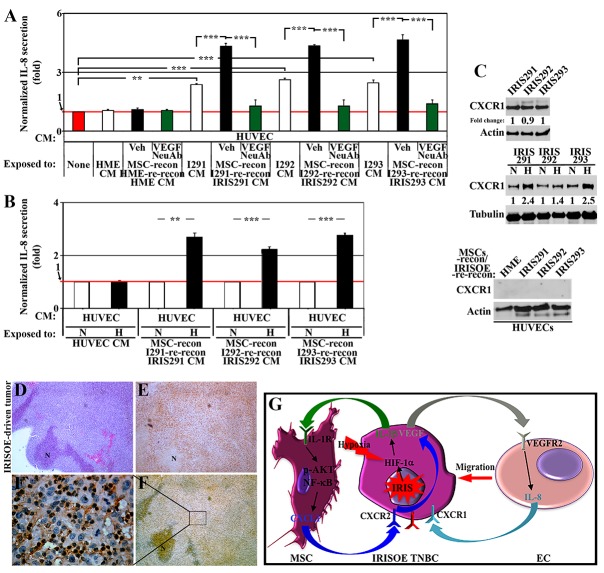
Figure 6. ECs respond by secreting IL-8 to re-activate IRISOE TNBC cells.
(A) Normalized IL-8 level detected by ELISA in CM from HUVECs unexposed (red bar), or exposed to HME, IRIS291, IRIS292 or IRIS293 CM (white bars), or same cells CM reconditioned by MSCs contact (24h) then reconditioned by the same mammary cell line contact (24h) in the absence (black bars) or presence of VEGF NeuAb (green bars). (B) Normalized IL-8 level detected by ELISA in the CM of HUVECs exposed to naïve HUVEC CM, or CM from normoxic (white bars), or hypoxic (24h, black bars) IRIS291, IRIS292 or IRIS293 cells reconditioned by MSC contact (24h). (C) The expression of CXCR1 on the surface of normoxic or hypoxic (24h) IRIS291, IRIS292 or IRIS293 cells (upper), or HUVECs exposed to CM from HME, IRIS291, IRIS292 or IRIS293 cells reconditioned by MSCs contact (24h), then by the same mammary cell line contact (24h, lower). (D-F) IHC analysis of CXCR1 expression in 1° IRISOE orthotopic tumor. (F`) Higher magnification image of the area squared in F. Scale bars: 500μm in D-F, and 50μm in F`. (G) Proposed model for signaling axis between IRISOE entrained by MSCs and HUVECs. Note, actin blots are the same as in Figure 5E, and that this experiment and the one in Figure 5E represent positive controls for one another.

