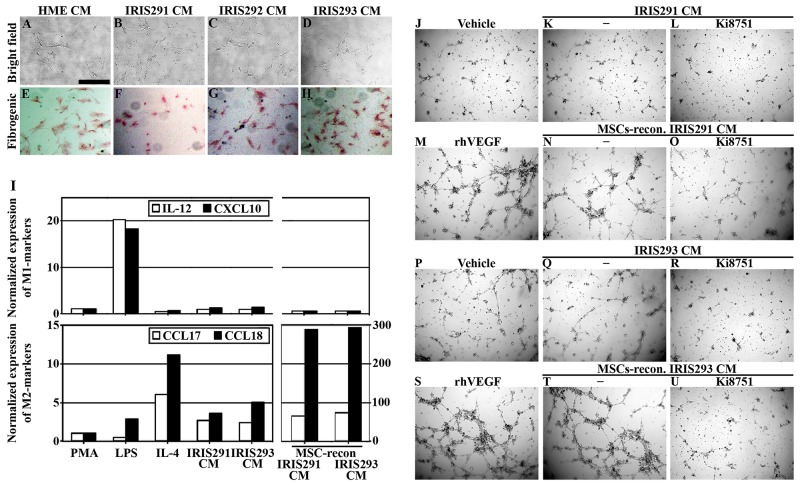
Figure 7. IRISOE TNBC tumor cells activate the microenvironment in vitro.
Bright field microscopy (A-D) or PicroSirius, fibrogenic staining (E-H) of MSCs exposed to HME, IRIS291, IRIS292 or IRIS293 cells CM, respectively. Scale bars: in (A-H) is 10μm. (I) Quantitative RT/PCR analysis of biomarkers for M1- (i.e. IL-12, and CXCL10, upper), or M2- (CCL17, and CCL18, lower) polarization of macrophage after exposure to; PMA, LPS, IL-4, IRIS291 cells CM, or IRIS293 cells CM reconditioned or not by MSC contact. The effect on HUVECs tube formation ability following treatment with vehicle (J and P), rhVEGF (M and S), IRIS291 cells CM in the absence (K) or presence (L) of Ki8751, IRIS293 cells CM in the absence (Q) or presence (R) of Ki8751, IRIS291 CM reconditioned with MSCs contact in the absence (N) or presence (O) of Ki8751, or IRIS293 CM reconditioned with MSCs contact in the absence (T) or presence (U) of Ki8751.

