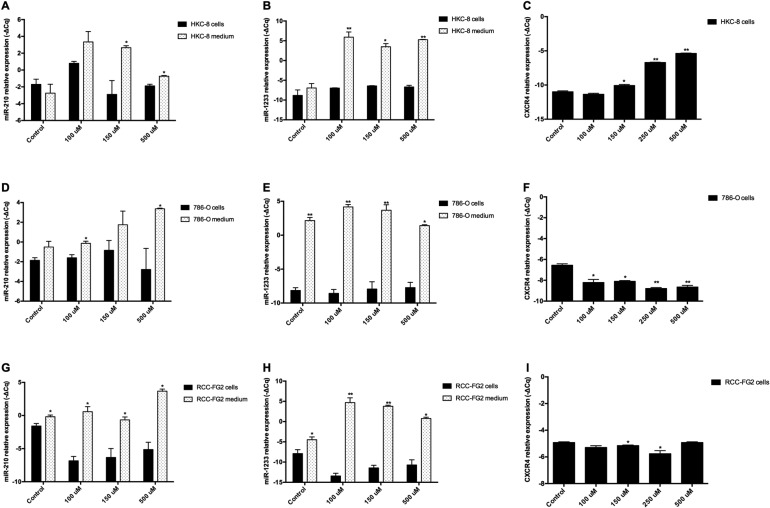
Figure 5. Extracellular expression of miR-210, miR-1233 and CXCR4 in HKC-8, 786-O and RCC-FG2 cell lines after hypoxia induction.
The bars represent the –ΔCq of miR-210, miR-1233 and CXC4 after hypoxia stimulation with crescent doses of CoCl2 for each cell line. (A) miR-210 levels in HKC-8 cell line after CoCl2 stimulation; (B) miR-1233 levels in HKC-8 cell line after CoCl2 stimulation; (C) CXCR4 levels in HKC-8 cell line after CoCl2 stimulation; (D) miR-210 levels in 786-O cell line after CoCl2 stimulation; (E) miR-1233 levels in 786-O cell line after CoCl2 stimulation; (F) CXCR4 levels in786-O cell line after CoCl2 stimulation; (G) miR-210 levels in RCC-FG2 cell line after CoCl2 stimulation; (H) miR-1233 levels in RCC-FG2 cell line after CoCl2 stimulation; (I) CXCR4 levels in RCC-FG2 cell line after CoCl2 stimulation; The –ΔCq of miR-210 and miR-1233 was normalized to RNU48 and the CXCR4 –ΔCq was normalized to GUSB. (Mean ± Std.Error; *P < 0.05, **P < 0.001).

