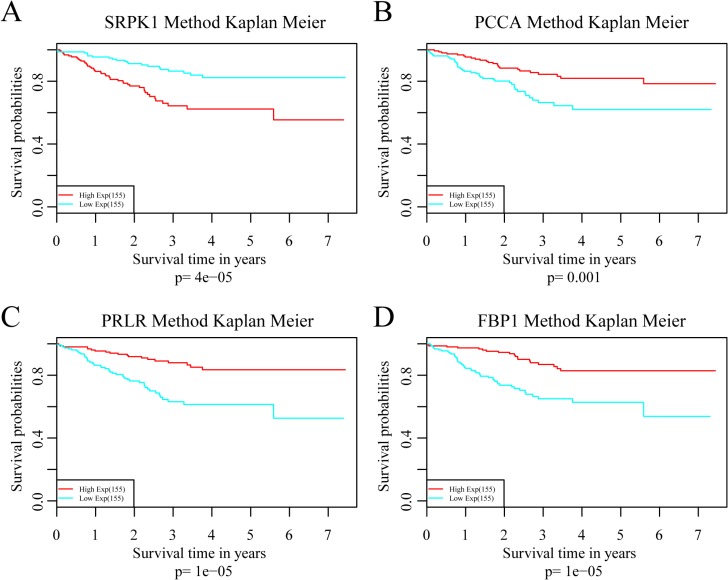
Figure 6. Analysis of the prognostic impact of each single signature gene.
(A) Kaplan–Meier curves for patients in SRPK1 high and low-expression groups. (B) Kaplan–Meier curves for patients in PCAA high and low-expression groups. (C) Kaplan–Meier curves for patients in PRLR high and low-expression groups. (D) Kaplan–Meier curves for patients in FBP1 high and low-expression groups.

