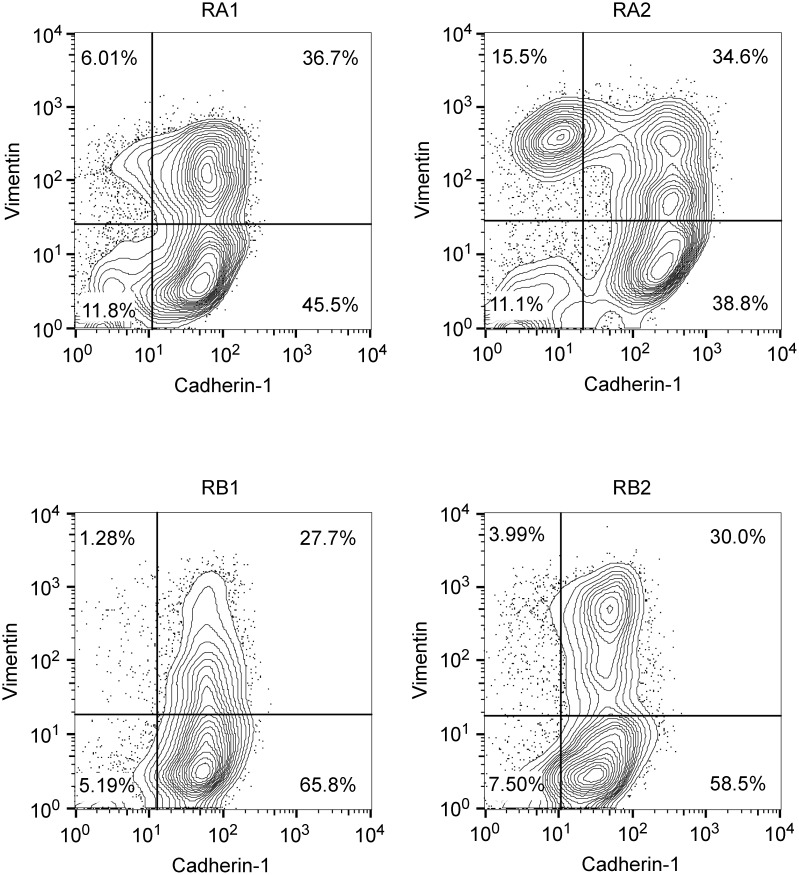
Figure 2. Double-color flow cytometry analysis of erlotinib-resistant NSCLC cell lines.
Shown are representative contour plots of RA1, RA2, RB1 and RB2 erlotinib-resistant cell line samples stained with Cadherin-1 as epithelial marker (x-axis) and Vimentin as mesenchymal marker (y-axis). Staining with isotype matched antibodies (data not shown) were used to set the gates and calculate the percentage of single positive and double positive subpopulations.

