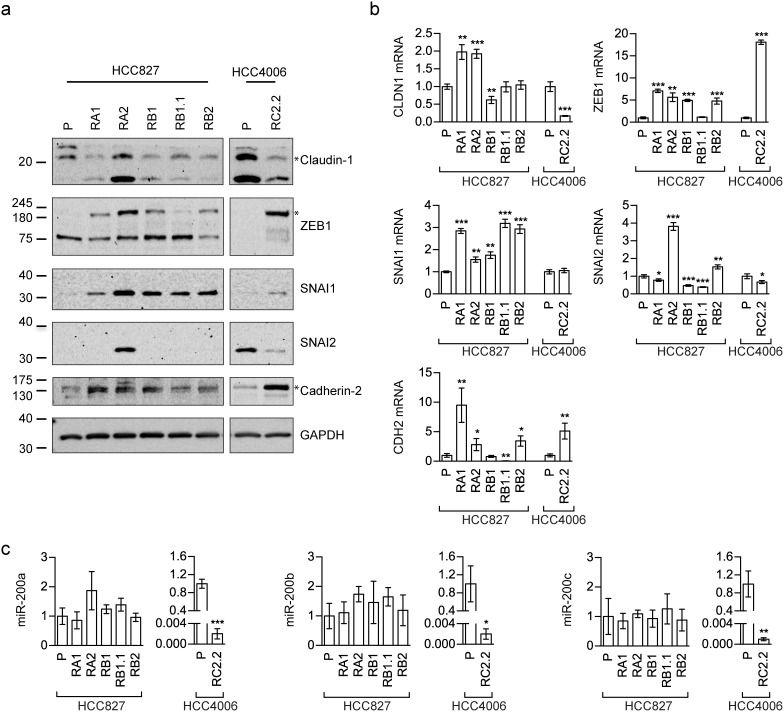
Figure 3. EMT markers expression in erlotinib-sensitive and -resistant cell lines.
(a) Western blot analysis of Claudin-1, Cadherin-2 (N-cadherin antibody), SNAI1 (Snail antibody), SNAI2 (Slug antibody) and ZEB1 in the indicated parental (P) and erlotinib-resistant cell lines; (b) qPCR analysis of the indicated mRNAsnormalized to the rp-L31 mRNA. Expression levels (y-axis) are expressed as relative abundance of derived compared to parental (P) cell lines (mean ± SD of triplicate determinations). (c) qPCR analysis of miR-200 family members (miR-200a, miR-200b and miR-200c) normalized to RNU24. Data are expressed as fold changes in expression levels of derived compared to parental (P) cell lines (mean ± SD of triplicate determinations). Asterisks in the figure indicate significant t-test p-values relative to the comparison of given derived cell lines with the corresponding parental one. * p < 0.05; ** p < 0.01; *** p < 0.001. Only significant p-values are shown.

