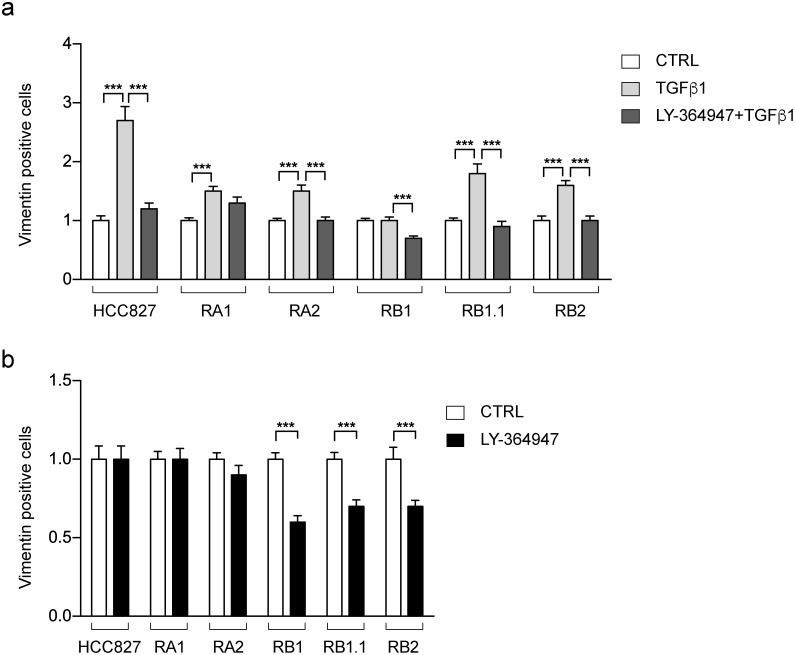
Figure 9. Vimentin positive cells in HCC827 erlotinib-sensitive and -resistant cell lines treated with TGF β1 and LY-364947.
Bar charts represent the fold-changes (mean ± SEM) of Vimentin positive cells resulted by the comparison of cell lines treated with TGF β1 alone or in combination with LY-364947 (a) and LY-364947 (b) with samples treated only with vehicle (CTRL in a and b). Data were obtained by the analysis of 24-30 immunofluorescence images for each cell line with at least 150-200 cells/image with the exception of RC2.2 cell line in which the images contained approximately 100 cells/images. The data are resulting from at least three independent experiments. Asterisks indicate significant t-test p-values in the comparison of CTRL vs LY-364947, CTRL vs TGF β1, TGF β1 vs LY-364947+ TGF β1 are shown; *** p < 0.001.

