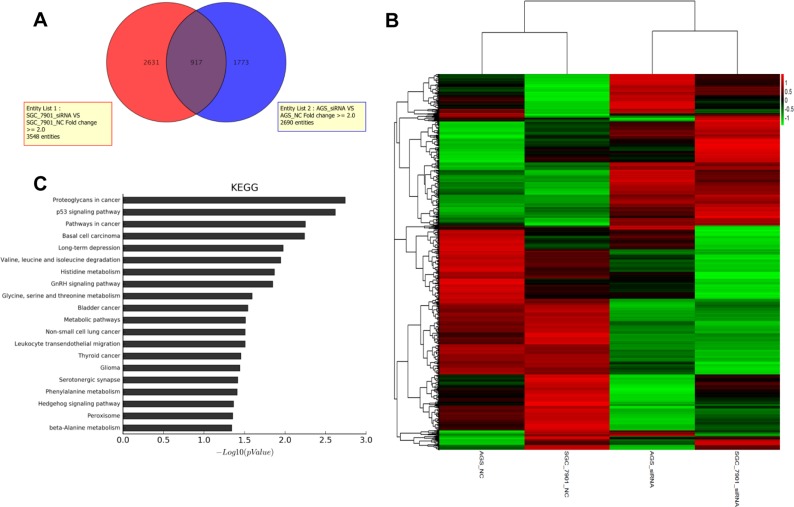
Figure 4. Function enrichment analysis of HNRNPK associated genes.
The Venn diagram showed the overlap between all genes that significantly change in HNRNPK knockdown group of AGS and SGC-7901 cells (A). The heatmap diagram showed the cluster of 917 overlap genes (B). The KEGG pathway analysis on the changed genes in HNRNPK knockdown group (C).

