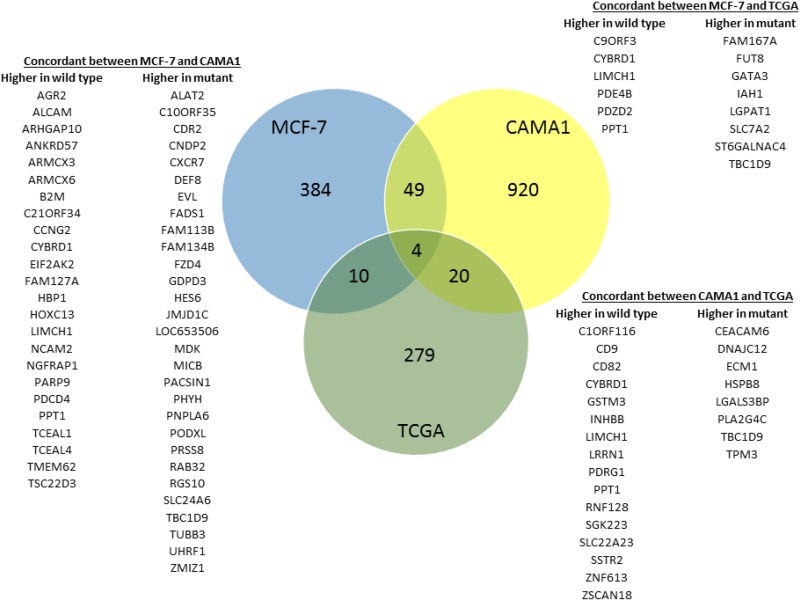
Figure 4. Differential gene expression related to GATA3 mutation.
Venn diagram showing overlap in differentially expressed genes in the isogenic MCF-7 and CAMA1 cell line panels and 594 ER + breast cancers from the TCGA dataset. Overlap between gene lists from MCF-7, CAMA1, and TCGA are all greater than expected by chance and statistically significant by hypergeometric probability (P < 0.004 for MCF-7/TCGA, P < 0.007 for CAMA1/TCGA, and P < 7 × 10–11 for MCF-7/CAMA1).

