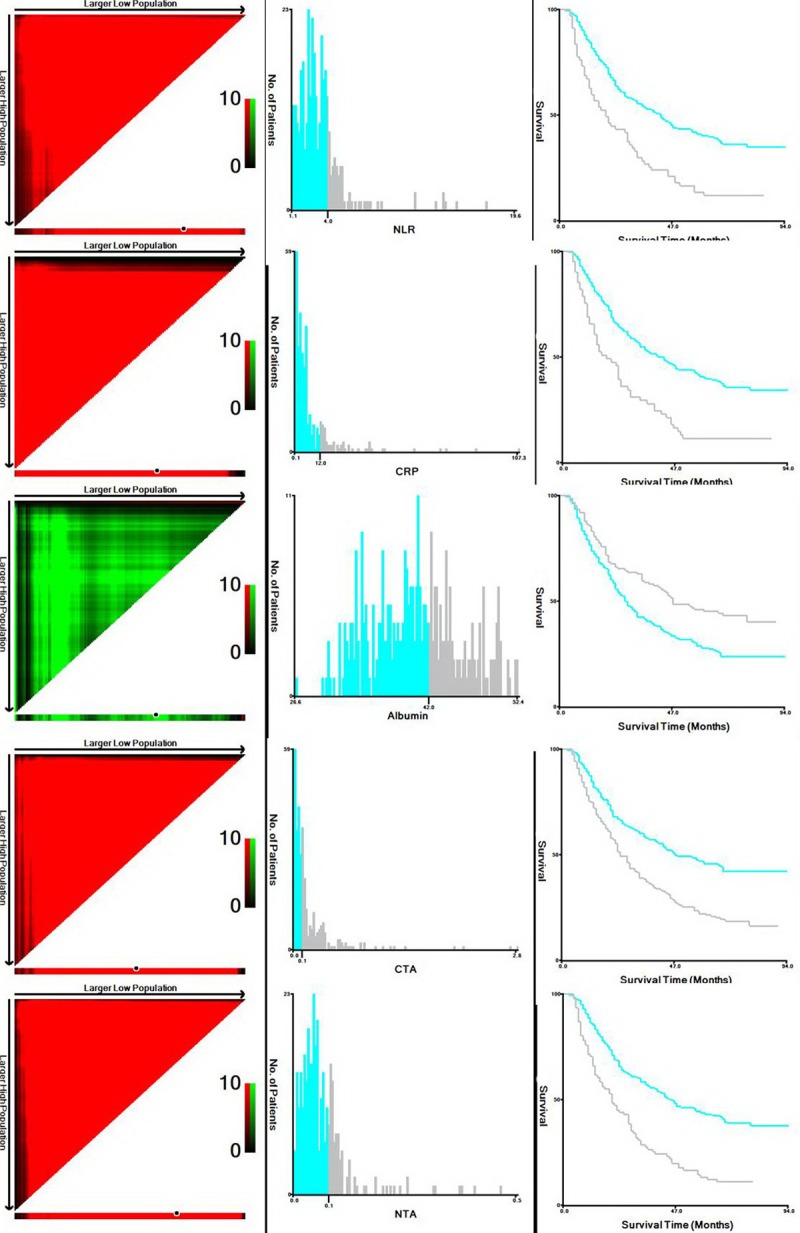
Figure 1. X-tile analyses.

X-tile plots of the training sets are shown in the left panels, with plots of matched validation sets shown in the smaller inset. The optimal cut-off point highlighted by the black circle in the left panels is shown on a histogram of the entire cohort (middle panels), and a Kaplan–Meier plot (right panels). According to the X-tile program, the optimal cut-off values for NLR, CRP, albumin, CRP/Alb and NLR/Alb were 4.0, 12.0 mg/l. 42.0 g/l, 0.1 and 0.1, respectively. (NLR = neutrophil lymphocyte ratio; CRP = c-reactive protein; CTA = CRP to albumin; NTA = NLR to albumin)
