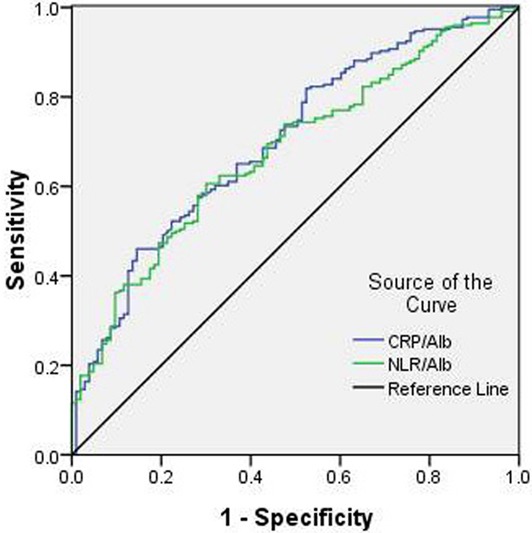
Figure 4. ROC curves for CSS prediction.

A ROC curve plots the sensitivity on the y-axis against one minus the specificity on the x-axis. A diagonal line at 45 degrees, known as the line of chance, would result from a test which allocated subjects randomly. Each point on the ROC cueve corresponds to a value by Youden Index (sensitivity+specificity-1). The areas under the curve (AUC) was 0.702 (95% CI: 0.635-0.763, P < 0.001) for CRP/Alb and 0.678 (95% CI: 0.574-0.716, P < 0.001) for NLR/Alb, respectively.
