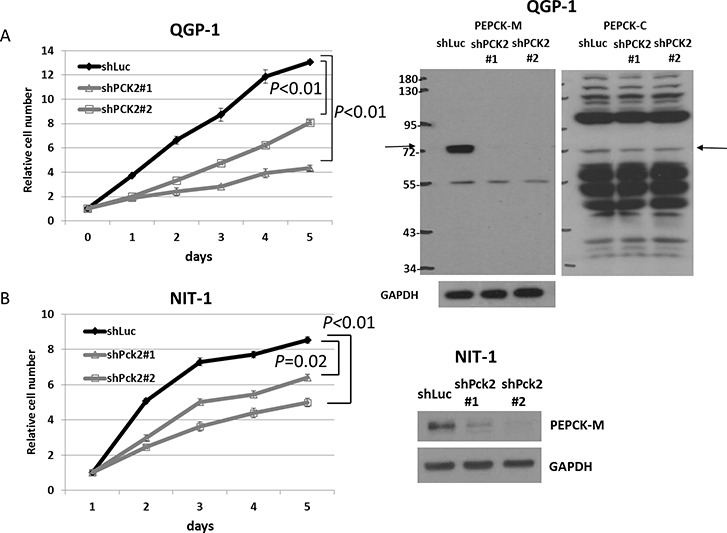
Figure 2. Cell proliferation curves of QGP-1 and NIT-1 cells with shRNA against PCK2 and Pck2 and vector control Luc from day 1 to day 5.

(A) (Left) QGP-1 cells with knockdown of PCK2 (2 clones, shPCK2#1 and shPCK2#2) had significantly lower rates of proliferation than QGP-1 cells infected with vector control (shLuc). (Right) The protein expression of PEPCK-M and PEPCK-C in QGP-1 cells with and without PCK2 knocked down. (B) NIT-1 cells with knockdown of Pck2 (2 clones, shPck2#1 and shPck2#2) had significantly lower rates of proliferation than NIT-1 cells infected with vector control (shLuc).
