
Figure 4. The result of gene expression microarray for QGP-1 cells with knockdown of PCK2 compared with QGP-1 infected with vector control (shLuc).
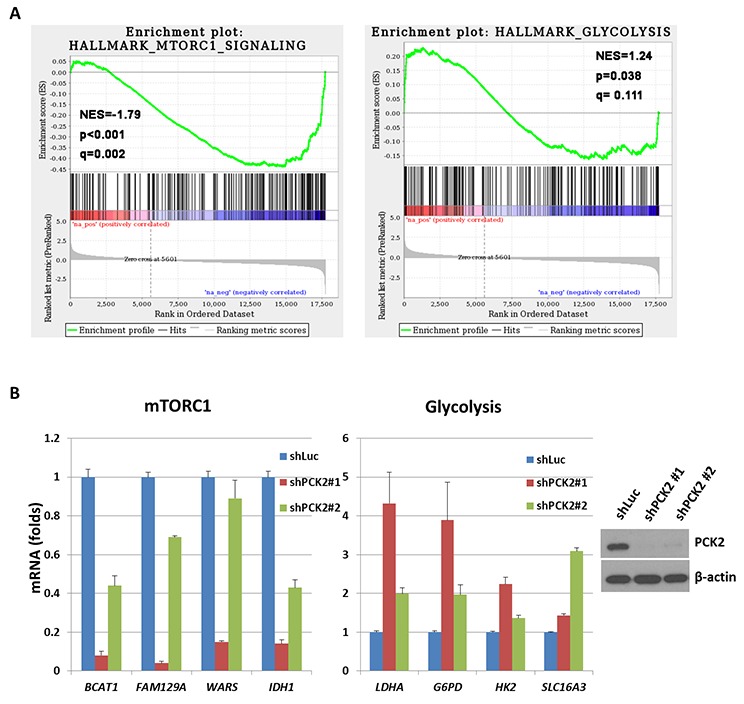
(A) Two representative significantly enriched gene sets in the differential expression profiles. Hallmark_mTORC1_sugnaling is negatively enriched (down-regulated) and Hallmark_Glycolysis is positively enriched (up-regulated) in general in QGP-1 cells with PCK2 knocked down. (B) the ratio of quantitative RT-PCR for 4 down-regulated genes, BCAT1, FAM129A, WARS, and IDH1 in mTORC1-related gene sets and 4 up-regulated genes, LDHA, G6PD, HK2, and SLC16A3, in Glycolysis-related gene sets in QGP-1 cells with knockdown of PCK2 (shPCK2) relative to that in QGP-1 cells without knockdown of PCK2 (shLuc).