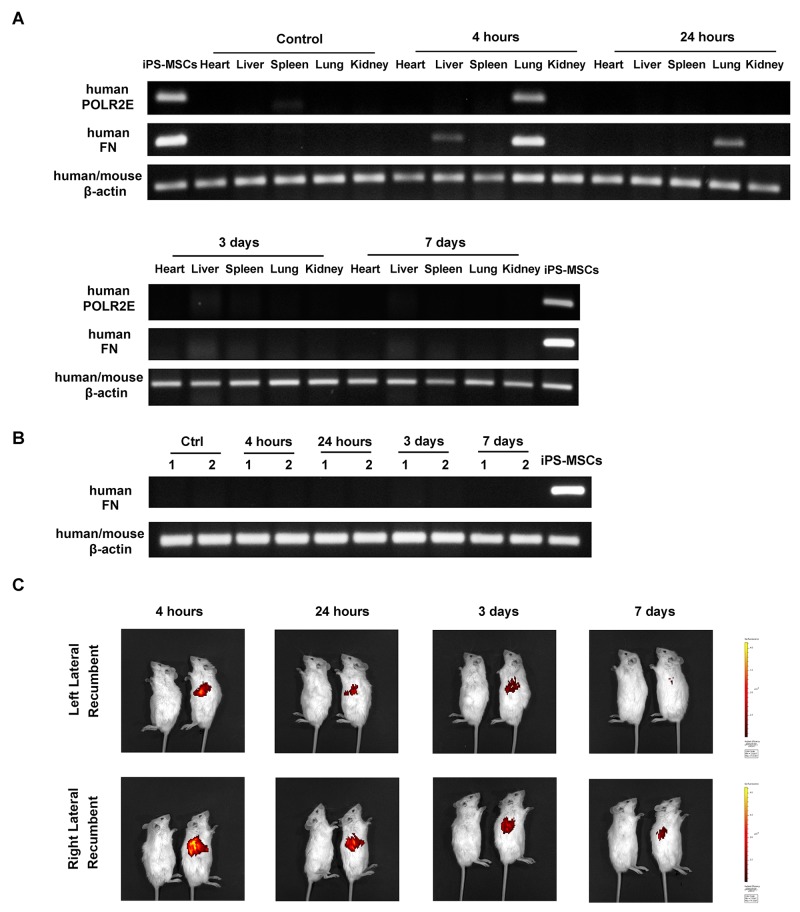
Figure 6. Stem cell tracking revealed trapping of iPS-MSCs in the lungs after intravenous injection.
(A) Representative agarose gels showing the expression of human POLR2E and FN mRNA in mouse heart, liver, spleen, lung, and right kidney by using specific primers. Data were representatives of 3 mice from each time point. (B) RT-PCR showing human FN mRNA expression in mouse left kidney at four different time points after iPS-MSC injection. Numbers (1-2) indicate individual mouse in a given group. (C) In vivo imaging of NOD/SCID mice. Mice were injected with unlabeled iPS-MSCs (left) or DiR-labeled iPS-MSCs (right).

