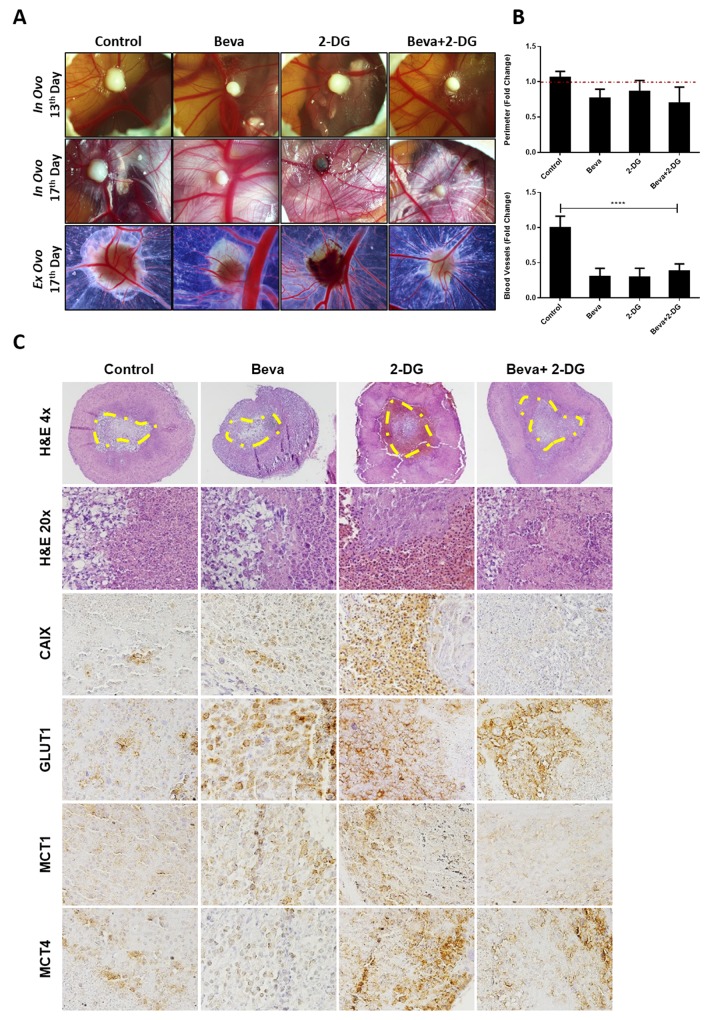
Figure 5. In vivo effect of Bevacizumab in combination with glucose analogue 2-DG in U251 induced tumors.
(A) In ovo pictures at 13th day of embryo development (4 days of tumor growth) and at 17th day (4 days of treatment, in ovo and ex ovo); representative pictures were taken at 20x in a Zeiss stereomicroscope. (B) Graphical representation of tumors perimeter (in relation to day 13 that was considered as 1 in each group) at the upper panel and of blood vessels (in relation to control without drugs, considered as 1) in the lower panel, showing a slight decrease on tumor size and significantly decrease in blood vessels on tumors treated with both Beva (2 mg/ml), 2-DG (1 mM) alone and 2-DG plus Beva. The results are representative for a media of 8 eggs per group; ****p<0.001 treated group vs control for blood vessels counting. (C) H&E and IHC expression of hypoxia and metabolic markers after 4 days of treatment with Beva, 2-DG and 2-DG+Beva. It is observed in the H&E a higher number of necrotic cells in the tumors that were treated with 2-DG and with Beva+2-DG. The IHC shows a decrease in CAIX expression in the combination group; GLUT1 increased in all groups; MCT1 expression increased after Beva treatment and decreased in combination group; MCT4 expression increased only in 2-DG conditions. The H&E pictures were taken with 4 and 20X objective, while and the ones from IHC were taken with 200X amplification in an Olympus microscope. The yellow line defines the necrotic area of U251 micro-tumors.

