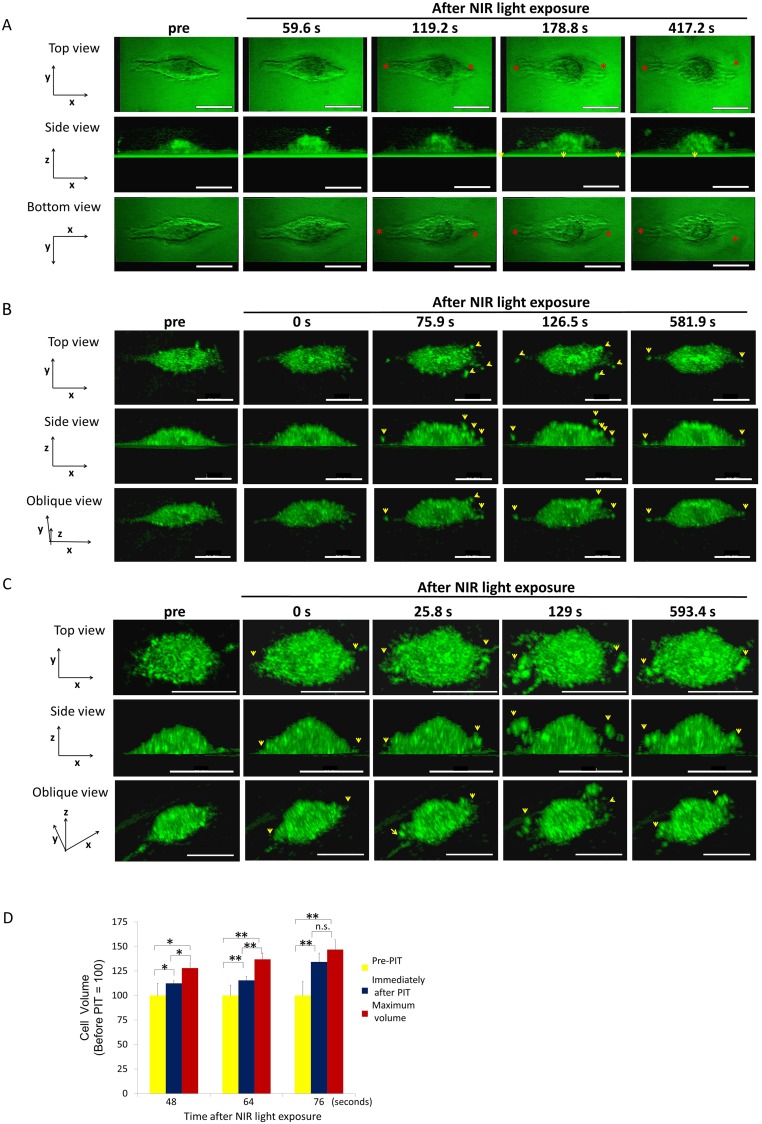
Figure 1. 3T3/Her cells increased in volume and ruptured after NIR-PIT.
Representative images from 3D-LC QPM imaging depict morphological dynamics in three regimens of NIR light exposure time, 48 sec (A), 64 sec (B) and 76 sec (C). The cell in (A) initially swelled, formed blebs and ruptured. The cell in (B) and the cell in (C) ruptured without antecedent bleb formation and in (C) had already burst by the end of NIR light exposure. Red asterisk indicates a bleb. Yellow arrowhead indicates a flying fragment. See also Supplementary Videos 1-3 which are side views of cells (A, B, and C). (D) Comparison of cell volumes before and immediately after NIR light exposure and maximum volume. The cells showed significant cell volume increases after NIR-PIT. Longer NIR light exposures (76 sec), caused more damage and there was no significant difference between the volume immediately after NIR light exposure and the maximum volume. Data are means ± SE. n = 12 in 46 sec and 64 sec. n =10 in 76 sec. *P < 0.05, **P < 0.01, ***P < 0.005 versus the other group. n.s. indicates no significant difference. s indicates second or seconds.

