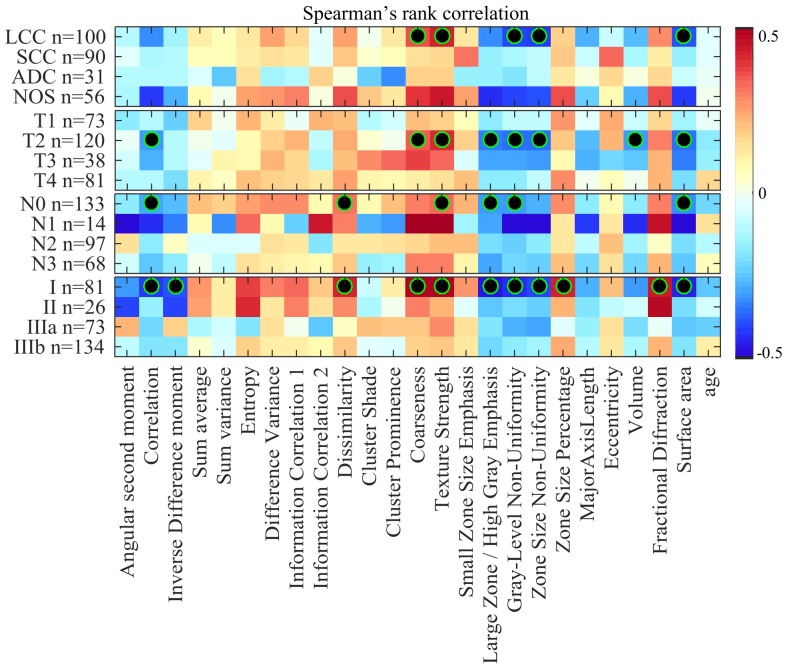
Figure 1. Heatmap of Spearman rank correlation between feature value and survival time, color-coded from -0.5 (dark blue) to 0.5 (dark red).
Censored patients were considered using an imputation strategy which computes their survival time as the mean survival of deceased patients with time-to-death greater or equal to censored patients’ time of last visit. Features with statistically significant correlation (i.e., corrected P < 0.05) are indicated with a black-green circle.

