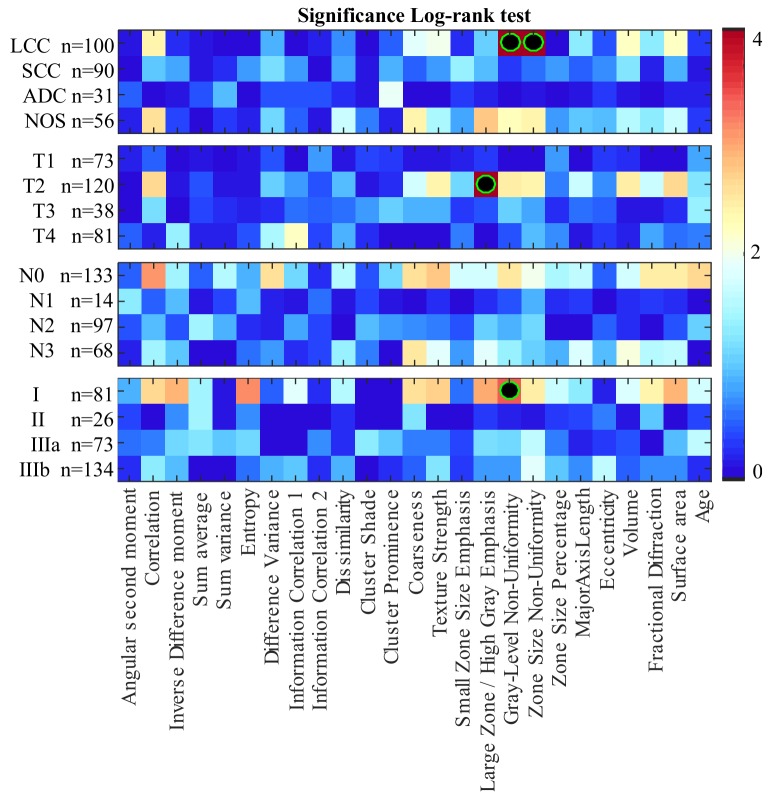
Figure 3. Heatmap of log-rank test p-values (–log10 scale) using features to separate patients in two groups: those with feature values less than the median, and those with values above or equal to the median.
Features leading to groups with significantly different survival profiles (i.e., corrected P < 0.05) are indicated with a black-green circle.

