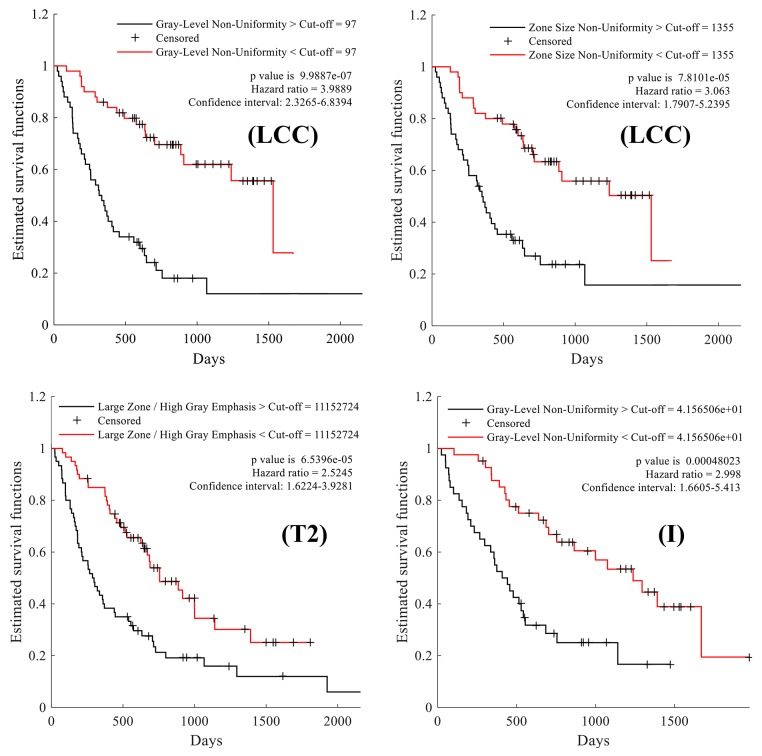
Figure 4. Kaplan-Meier survival curves comparing the survival rate of patient groups obtained using median feature values as cut-off.
Large cell carcinoma (LCC) patients split using the median value of the following texture features: grey-level non-uniformity and zone size non-uniformity, respectively. Patients with tumor size of T2 and Stage I cancer, separated based on the median value of the following texture features: large zone/high grey emphasis and grey-level non-uniformity, respectively.

