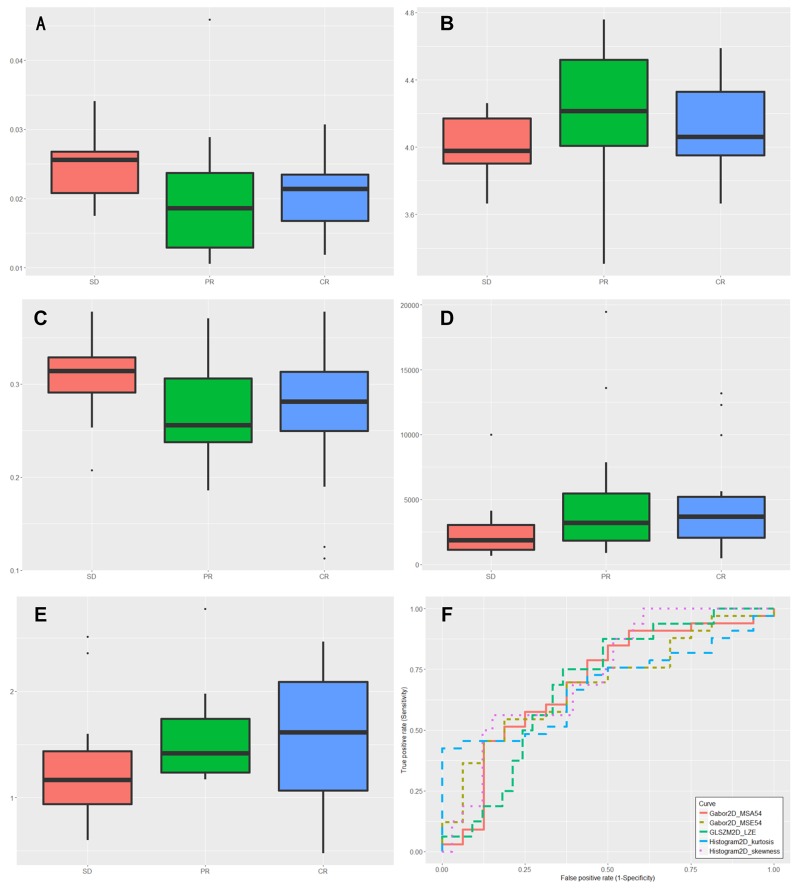
Figure 1. Box plots of the amplitudes of features, successfully differentiating nonresponders (stable disease [SD]) from responders (complete response [CR], partial response [PR]).
(A) Histogram2D_skewness (P=0.0078). (B) Histogram2D_kurtosis (P=0.0355). (C) GLSZM2D_LZE (P=0.0396). (D) Gabor2D_MSA-54 (P=0.0418). (E) Gabor2D_MSE-54(P=0.0465). (F) ROC curve for Histogram2D_skewness, Histogram2D_kurtosis, GLSZM2D_LZE, Gabor2D_MSA-54 and Gabor2D_MSE-54 for classification responders from nonresponders.

