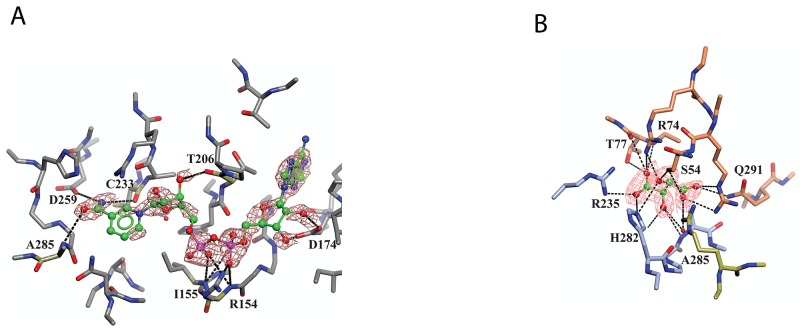
Figure 5. Binding of NAD+ and L-tartrate to sPHGDH.
Human sPHGDH structure showing interactions with cofactor NAD+ (A) and substrate analogue L-tartrate (B). (A) sPHGDH and NAD+ are coloured by atom type and hydrogen bonds are indicated as dashed lines. (B) sPHGDH and L-tartrate are coloured by atom type with carbon atoms of sPHGDH coloured in coral (lid domain) and light blue (core domain) depending on which domain they belong to. Electron density map (2Fo-Fc map) for NAD+ and L-tartrate is contoured at 1.3 electrons/A3 and is shown as orange mesh.

