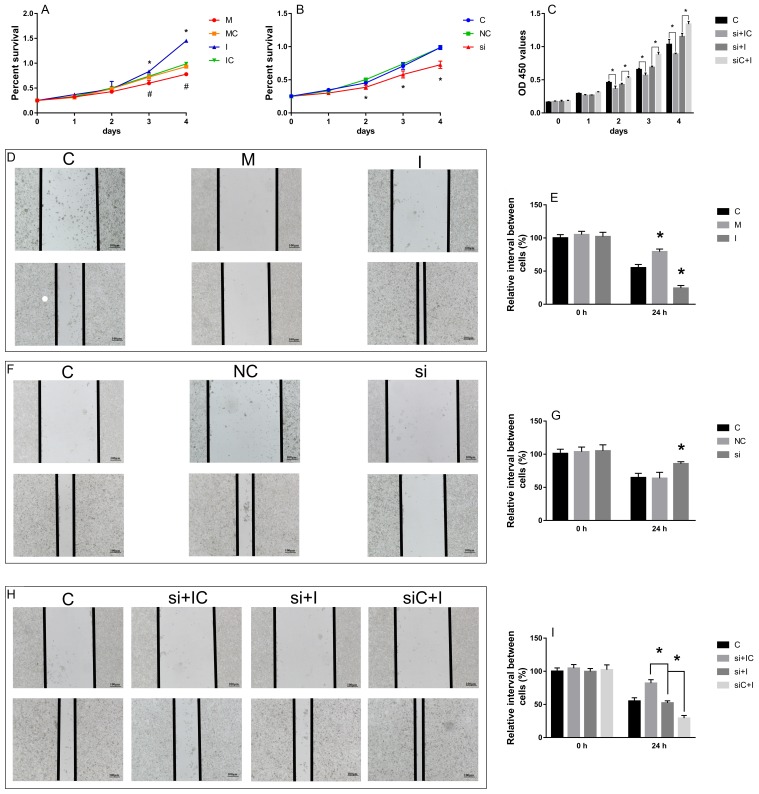
Figure 10. The effect of hsa-miR-29c-3p and SPARC on cell migration and proliferation.
(A-C) the CCK-8 assay. (D-I) the wound healing assay. *P < 0.05 (A) C group is the control group. I group is the hsa-miR-29c-3p inhibitor group. M. the hsa-miR-29c-3p mimic group. (B) C group is the control group. NC group is the negative control group. si group is the si-SPARC group. (C) C group is the control group. si + IC group is the si-SPARC + inhibitor control group. si + I group is the si-SPARC + inhibitor group. siC + I group is the si-SPARC control + inhibitor group.

