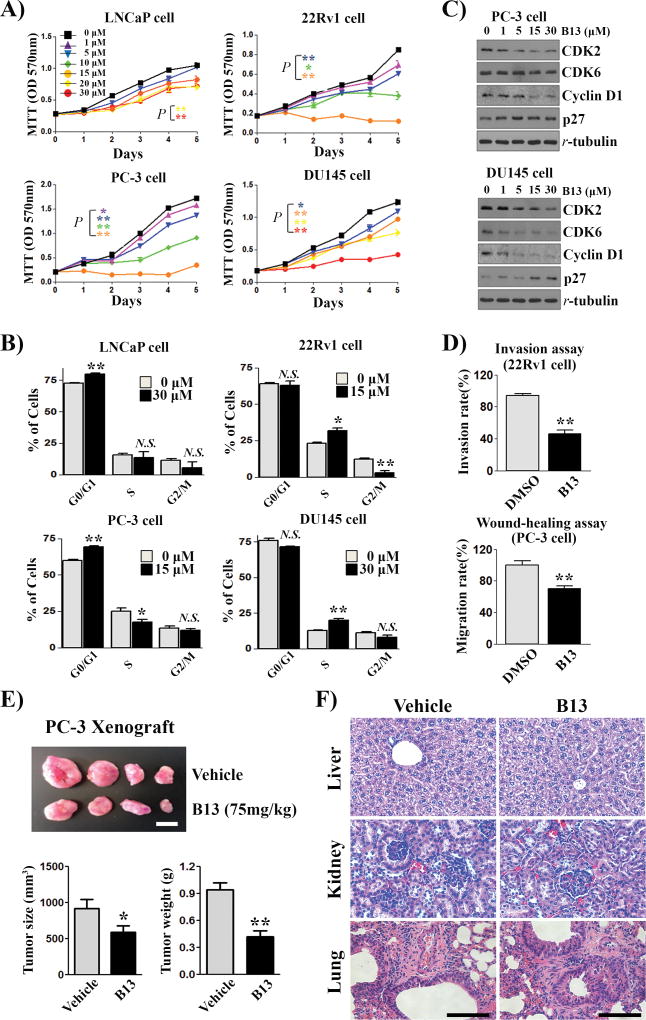
Figure 7. The myristoyl-CoA analog B13 inhibits cell cycle progression and growth of xenograft tumors.
(A) Prostate cancer cell lines were cultured with B13 for 5 d and cell proliferation was measured. The value is expressed as the mean ± SEM (n=6 wells). The statistical analysis is indicated by the color representing the labeled concentration of B13 treatment. (B) Cell cycle analysis of LNCaP, 22Rv1, PC-3, and DU145 cells cultured with B13 for 3 d. The percentage of cells in G0/G1, S, and G2/M phases was compared between the control and B13 treatment. (C) PC-3 and DU-145 cells treated with/without different concentrations of B13 were analyzed for the expression levels of CDK2, CDK6, cyclin D1, p27, and tubulin by immunoblotting. (D) 22Rv1 and PC-3 cancer cells grown with/without 15 µM B13 were examined in the Transwell invasion assay and the wound-healing assay, respectively. (E) PC-3 prostate cancer cells were subcutaneously injected into both flank sides of SCID mice (3 months-old, n=6 per group). Vehicle or B13 (75mg/kg/mouse) were administered intravenously twice a week for 6 weeks. Representative images of the xenograft tumors are shown (upper panel; scale bar, 10 mm). The size and weight of xenograft tumors were measured as mean ± SEM (bottom panel). *: P<0.05, **: P<0.01. (F) Histology analysis of B13 on major organs. H&E staining of liver, kidney, and lung tissues derived from (E) were evaluated. Scale bar, 400 µm.

