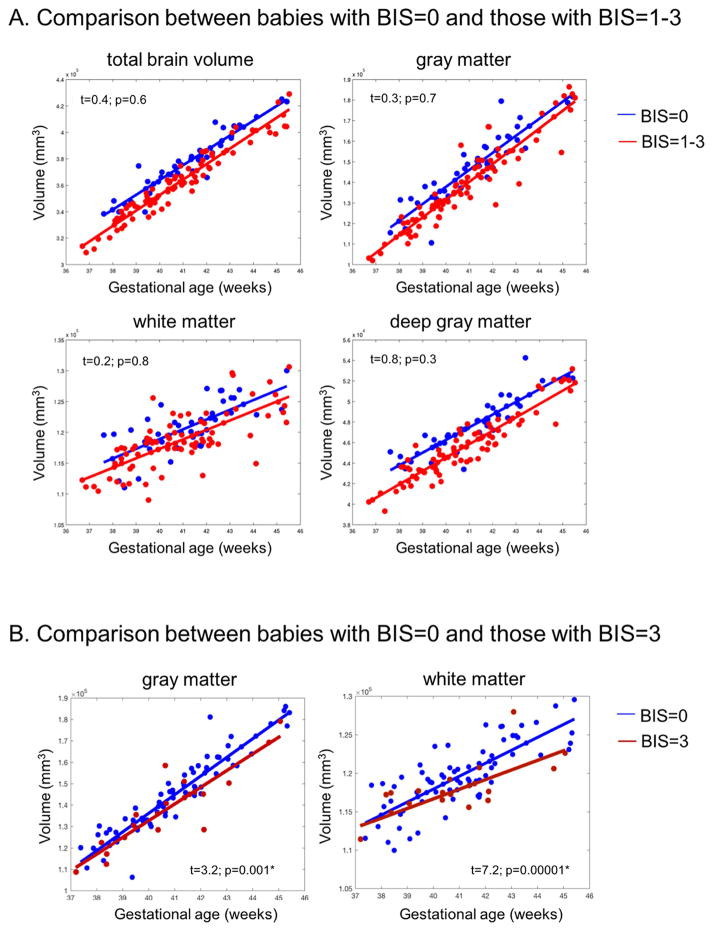
Figure 3.
A) Brain global/regional volume changes in the presence of brain injury (red line- cumulative BIS > 0) and without brain injury (blue line- cumulative BIS = 0). The x-axis represents the gestational age at the time of MRI and the y-axis represents the volume in mm3. The plot includes pre- and post-operative brain MRI measures for each subject with a best-fitted line. Plots with paired observations for each subject are included in supplementary Figure 1. Overall, mean global and regional (gray matter and deep gray matter) brain volumes were lower in subjects with brain injury as compared to those without brain injury. However, the rate of global and regional volume change over time was not associated with brain injury (all p-values > 0.1). B) Brain regional volume changes in gray and white matter in the presence of no brain injury (blue line- cumulative BIS= 0) and in those with moderate to severe white matter injury (dark red line- cumulative BIS= 3). Those with moderate to severe WMI have significantly slower growth in gray matter and white matter as compared to those without injury (p= 0.001 and p< 0.0001 respectively).

