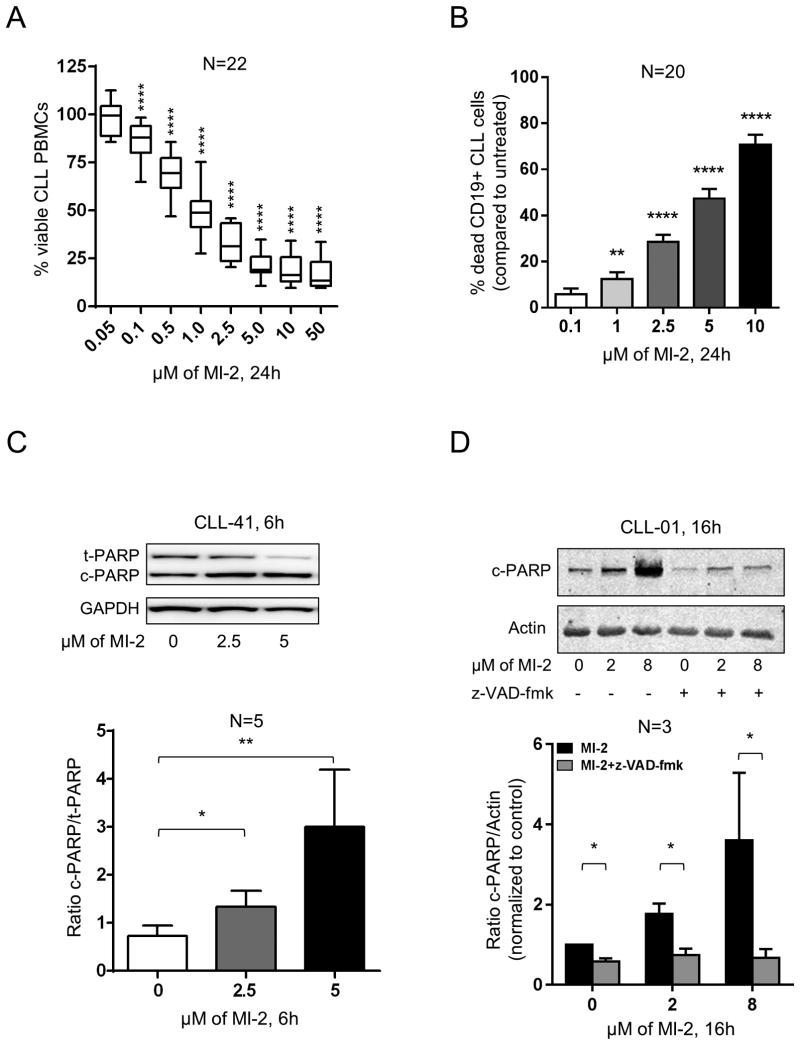
Figure 2. Targeting MALT1 with MI-2 results in dose- and time-dependent apoptotic cell death in CLL.
(A) PBMCs from 22 patients with CLL were incubated in duplicates with increasing concentrations of MI-2 for 24h. Cell viability was quantified using MTS assay and shown as % of untreated control. (B) Percent dead CD19-gated CLL cells (CD19+/Annexin-V+/ViViD+; N=20) relative to untreated control is shown after 24h treatment with MI-2. Error bars represent SEM. (C) A representative immunoblot showing the change in expression of total and cleaved PARP (t-PARP and c-PARP, respectively) in purified CLL cells (CD19-selected) following a 6h exposure to 2.5 and 5 μM of MI-2. GAPDH is shown as a loading control. Ratio of c-PARP/t-PARP (± SEM) of purified CLL cells collected from 5 patients following treatment with MI-2. Error bars represent SEM. (D) A representative immunoblot showing the change in expression of c-PARP in purified CLL cells following a 16h exposure to 2 and 8 μM of MI-2 in the presence or absence of z-VAD-fmk. Actin is shown as a loading control. Ratio of c-PARP/Actin (± SEM) of purified CLL cells collected from three individual patients following treatment with MI-2 (+/-z-VAD-fmk). Error bars represent SEM.
SEM, standard error of mean; -, absence; +, presence; NS, non-significant; ND, normal donor; *, P<0.05; **, P<0.01; ****, P<0.0001.

