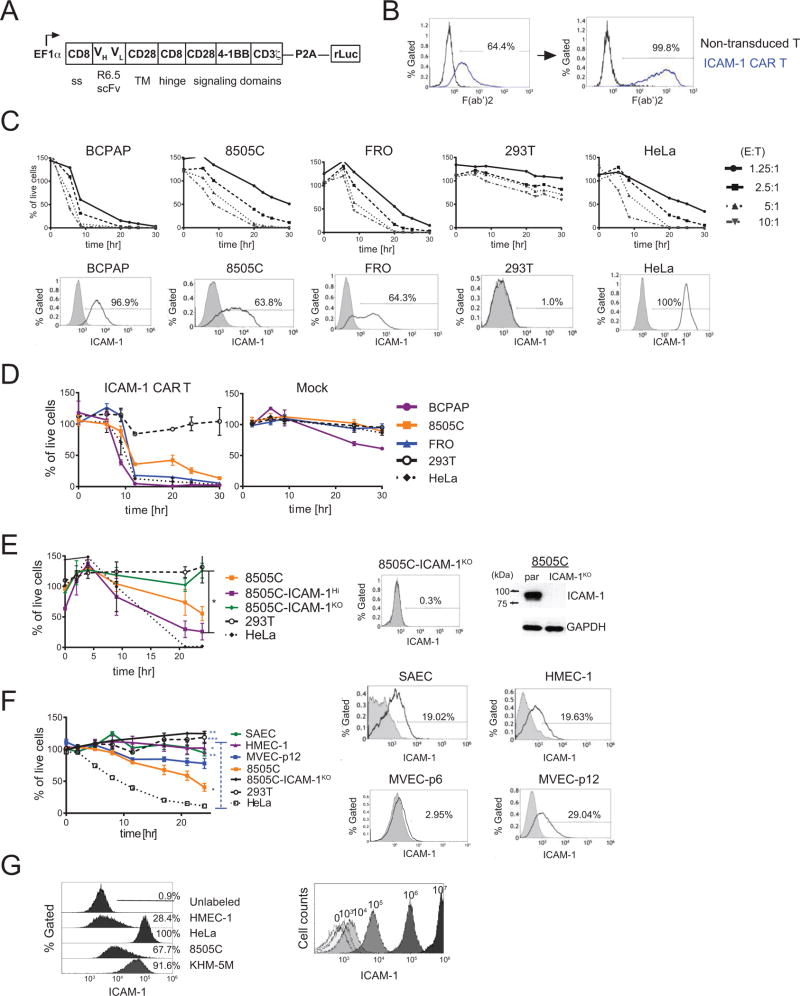
Figure 3. ICAM-1-targeting CAR T activity is specific to the ICAM-1 expressing target cells.
(A) Schematic demonstrating the ICAM-1 CAR T construct (B) Histogram plots demonstrating CAR expression in ICAM-1 CAR T cells was detected using a F(ab’)2 antibody before (left) and after (right) sorting via F(ab’)2. (C) (top) The percentages of live target cells remaining after exposure to ICAM-1 CAR T plotted over time. Values were normalized to target cells with no T cell addition. The E:T ratio was incremented by a factor of 2 from 1.25:1 to 10:1. (bottom) Flow cytometry plots indicating the level of ICAM-1 expression in target and control cells after staining with the R6.5 anti-ICAM-1 antibody. Gates for ICAM-1+ cells were determined based on staining with isotype control (grey filled histogram). (D) Compilation of the percentages of live target cells remaining after exposure to ICAM-1 CAR T and mock transduced T cells plotted over time (normalized against no T cell addition group, n=4–7 per target cell line). (E) ICAM-1 CAR T cytotoxicity against parental 8505C cells and 8505C cells with high (ICAM-1Hi) or minimal (ICAM-1KO) ICAM-1 expression. The plotted percentages of live cells were normalized against corresponding target cells incubated with non-transduced T cells to minimize the T cell alloreactivity. A statistical difference was observed between the number of live 8505C-ICAM-1KO and 8505C-ICAM-1Hi cells remaining at the 24 and 30 hr timepoint (*, p<0.05 by Dunn’s multiple comparison test). 8505C-ICAM-1KO cells were generated using CRISPR/Cas9, and ICAM-1 expression levels were analyzed by flow cytometry and Western blot analysis (right). (F) ICAM-1 CAR T cytotoxicity against normal primary cells along with control target cells. Membrane-bound ICAM-1 expression on normal primary cells was characterized by flow cytometry (right). Statistical differences were analyzed between the SAEC, HMEC-1, and 293T cells relative to HeLa cells. 8505C cells were compared to 293T cells (*, p<0.05; **, p<0.01; ***, p<0.001 by Dunn’s multiple comparison tests at 24 hr) (n=3–6 per target cells). (G) Histograms of latex beads coated with a fixed number of R6.5 anti-ICAM-1 antibodies were analyzed by flow cytometry on the right. Histograms plots for various target cells with R6.5 antibody on the left were used to estimate the number of ICAM-1 molecules.

