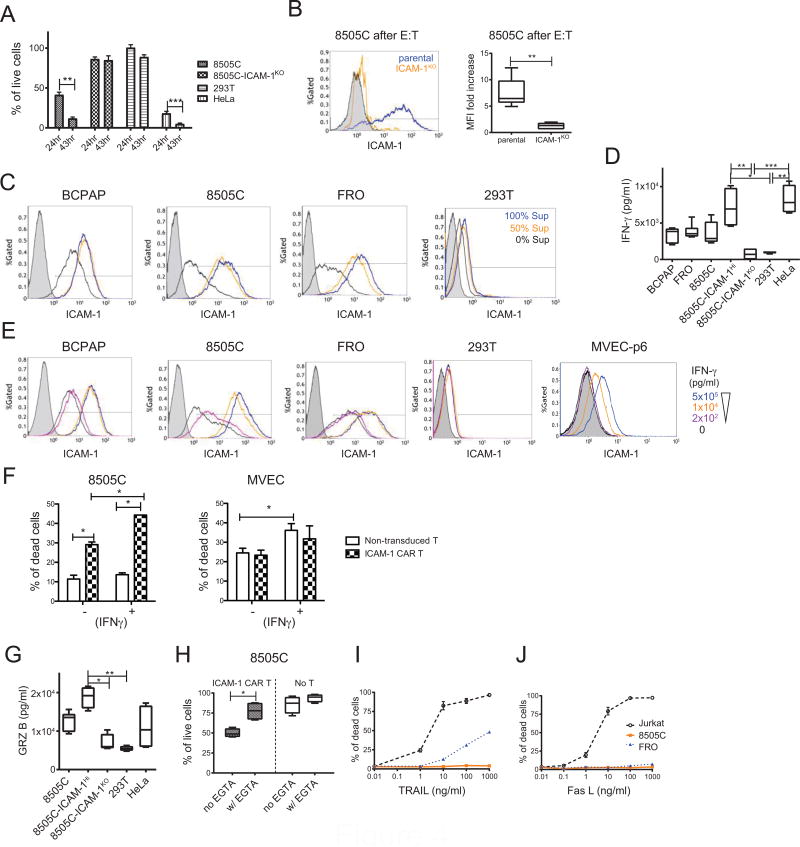
Figure 4. ICAM-1 expression on thyroid cancer cells is IFN-γ inducible by enhancing target susceptibility to ICAM-1 CAR T.
(A) The percentages of remaining viable target cells remaining after co-culturing with ICAM-1 CAR T cells were compared between 24 hr and 43 hr timepoints (n=6–9 per target cells). (B) After an 18 hr co-incubation with ICAM-1 CAR T cells, 8505C (blue line) and 8505C-ICAM-1KO (orange line) cells were collected and stained for ICAM-1 expression in live cells by flow cytometry (left). 8505C cells stained with isotype control are shown by gray filled histogram. Quantitation of the fold increase of ICAM-1 mean fluorescence intensity (MFI) is shown on the right relative to non-exposed cells (n=6 per target cells). (C) Representative flow cytometry plots show thyroid cancer cell ICAM-1 expression after 18 hr culture in media spiked with supernatant derived from E:T experiments using ICAM-1 CAR T. Supernatants from the ICAM-1 CAR T: target cell assay were collected and added to the indicated target cells with no dilution (blue line), 50% dilution (orange line), or no addition (black line) to the culture media. (D) The IFN-γ levels in supernatants collected from E:T assays involving ICAM-1 CAR T against indicated target cells were measured using ELISA (n=4–8). Non-transduced T cells cultured with the same target cells produced levels of IFN-γ that were below the limit of detection. (E) Flow cytometry analysis demonstrating ICAM-1 expression changes in thyroid cancer and control cells upon direct administration of exogenous, serially diluted IFN-γ (pg/ml). (F) The percentages of cell death observed in untreated and IFN-γ (1 × 10⁴ pg/ml) added target cells were compared after addition of non-transduced T and ICAM-1 CAR T cells using flow cytometry analysis (n=3). (G) The concentration of secreted granzyme B from an ICAM-1 CAR T: target cell assay (n=4–6) per condition. (H) 4 mM EGTA was added to E:T assay media to inhibit the perforin/granzyme cytotoxic pathway (n=4 per group). (I) Anaplastic thyroid cancer resistance to TRAIL-induced death (J) Anaplastic thyroid cancer resistance to FasL-induced death. The Jurkat T cell line served as a positive control for both treatments (n=3–4 per condition).

