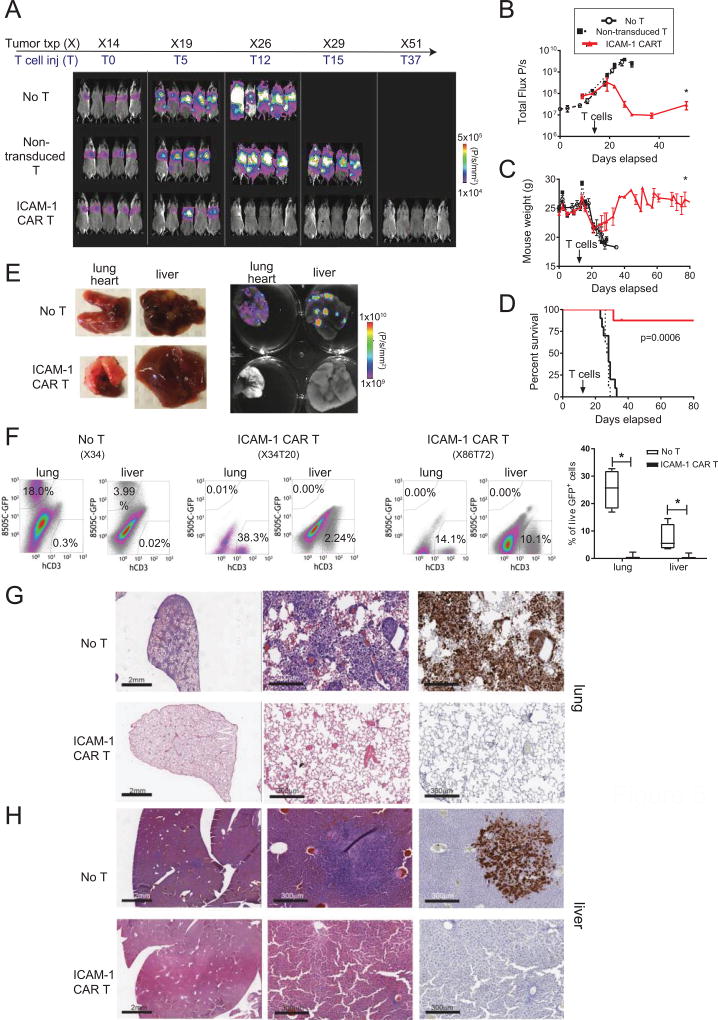
Figure 5. ICAM-1 CAR T cells show robust and enduring tumor eradication in ATC xenograft models.
(A) Representative total body bioluminescence images of fLuc+ 8505C xenografted NSG mice following ICAM-1 CAR T cell administration. Control groups include untreated and non-transduced T cell-administered mice. (B) Quantitation of total body bioluminescence units in individual mice from (A) (no T cell group=open circle, non-transduced T cells=solid square, ICAM-1 CAR T=red triangle; * marks p=0.05, n=8–10 per group). (C) Summary of body weight changes in mice left untreated or after treatment with non-transduced T cells or ICAM-1 CAR T cells (* marks p=0.05). (D) Survival curves of 8505C xenografted mice comparing no treatment, treatment with non-transduced T cells, and treatment with ICAM-1 CAR T cells until 80 days post-xenograft. Statistical differences between different treatments were analyzed by Kaplan-Meier (n=8–10 per group). (E) (left) Gross inspection of 8505C xenograft metastatic organs (lung, liver) taken 20 days after ICAM-1 CAR T treatment compared with untreated mouse organs. (right) Ex vivo GFP fluorescence images of the organs merged with bright field images. Scale bar is shown on the right. (F) (left) Flow cytometry plots showing analysis of percentages of GFP+ 8505C (y-axis) and human CD3+ T cells in indicated organs extracted from untreated and ICAM-1 CAR T treated 8505C xenografted mice (20 and 72 days after T cell administration). (bottom) Compilation of the frequency of live, GFP+ 8505C cells observed in the lung and liver with and without ICAM-1 CAR T treatment. (G, H) Representative IHC images showing H & E staining of low (left) and high (middle) magnifications of lung (G) and liver (H) tissues isolated from xenografted mice receiving no T cell (top) or ICAM-1 CAR T (bottom) treatment. The adjacent sections were stained for GFP to identify tumor cells (right). Scale bar = 2 mm (left), 300 µm (middle, right)

