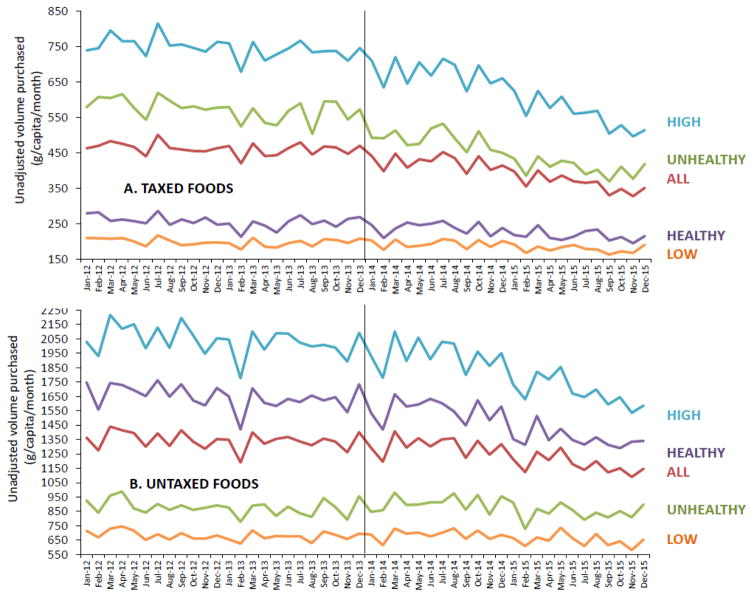
Figure 1.
Unadjusted monthly trends in predicted volume purchased (g/capita/month) of A) Taxed and B) Untaxed foods for the overall sample and by pre-tax household food purchasing group. Source: Authors’ own analyses and calculations based in part on data reported by Nielsen through its Mexico Consumer Panel Service for food and beverages or the January 2012 to December 2015. Nielsen data is licensed from The Nielsen Company, 2017. The conclusions drawn from the Nielsen data are those of the authors and do not reflect the views of Nielsen. Nielsen is not responsible for and was not involved in analyzing and preparing the results reported herein.

