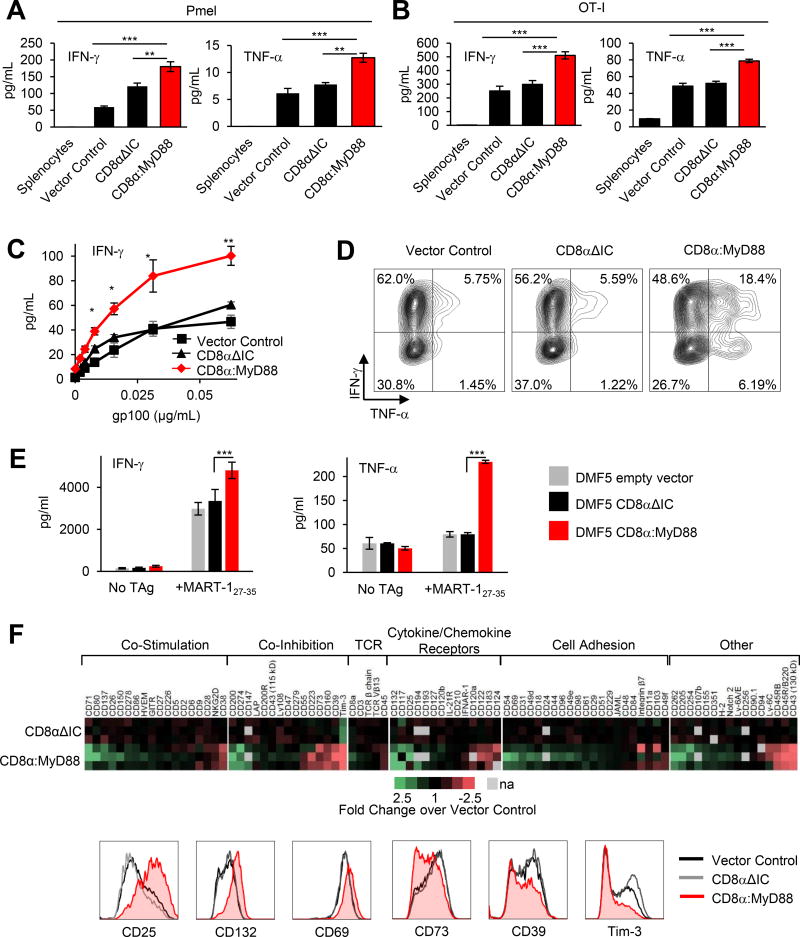
Figure 2. CD8α:MyD88 T cells exhibit enhanced cytokine production and alter the expression of co-stimulatory and co-inhibitory molecules in response to tumor antigen.
IFN-γ and TNF-α levels measured by ELISA in supernatants from A) pmel T cells co-cultured with gp10025–33-pulsed splenocytes and B) OT-I T cells with OVA (SIINFEKL)-pulsed splenocytes at 24 hours. C) IFN-γ production by engineered pmel T cells co-cultured with gp10025–33--pulsed splenocytes. D) Intracellular cytokine staining of pmel T cells stimulated with splenocyte pulsed with 5 µg/mL gp10025–33. E) Cytokine production by DMF5 empty vector, DMF5 CD8α or DMF5 CD8α:MyD88 human T cells in response to stimulation with MART-127–35-pulsed PBMCs as measured by ELISA 4 days later. Data from three independent experiments with three replicates per reaction is shown. Values represent mean ± s.e.m.; *** p≤ 0.001, one-way ANOVA; F) Flow cytometry screen of pmel T cells co-cultured for 48 hours with splenocytes pulsed with 0.12 µg/mL gp100. The fold change of the median fluorescence intensity (MFI) of CD8αΔIC and CD8α:MyD88 T cells over control vector T cells from three independent experiments is displayed in a heat map. Gray boxes represent data not available, na. Representative histograms are shown of the expression of most upregulated and downregulated molecules. Values and error bars represent mean ± s.e.m.. *p≤0.05, **p≤0.01, ***p≤0.001 A–C) One-way ANOVA with Tukey’s Multiple Comparison Test at each concentration; n=3 experimental replicates; representative of at least two independent experiments.

