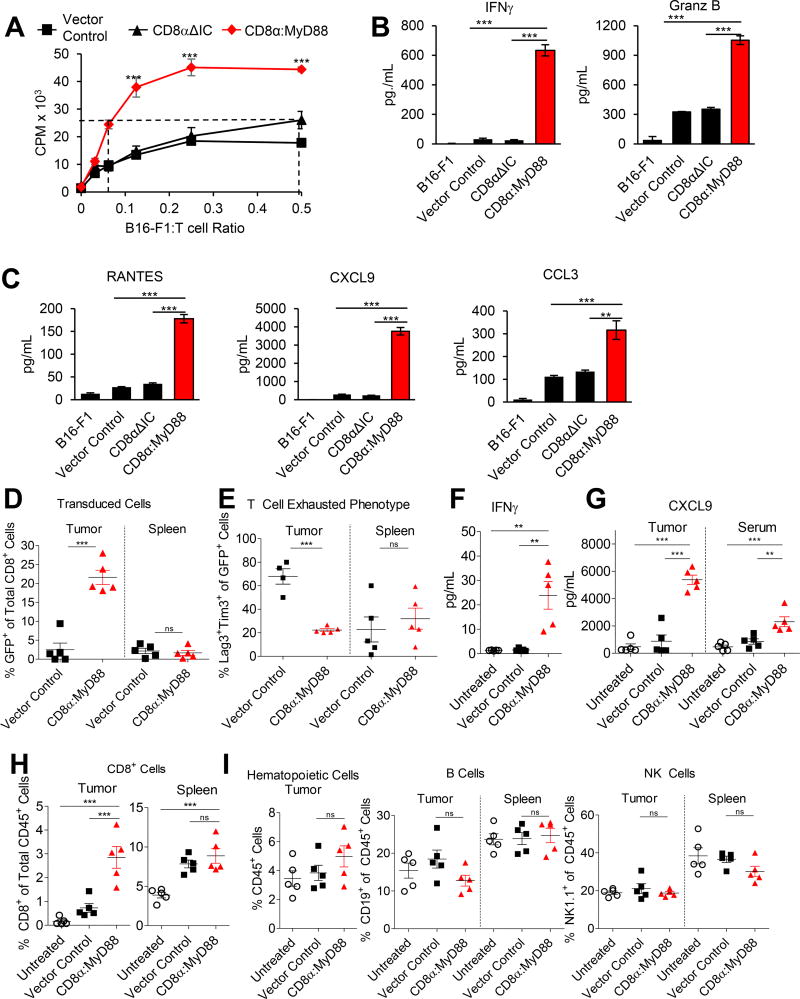
Figure 3. CD8α:MyD88 T cells display improved responses to melanoma in vitro and in vivo.
A) Proliferation of engineered pmel T cells stimulated with irradiated B16-F1 tumor cells for 72 hours. B–C) ELISA and Luminex analysis of cytokines and chemokines in the supernatant of T cells co-cultured with B16-F1 tumor cells for 48 hours. D–I) Mice bearing established B16-F1 tumors were exposed to a sublethal dose of irradiation (550 rads) followed by transfer of T cells by intraveneous injection one day later. Tissues were harvested and analyzed by flow cytometry one week after T cell transfer. D) The frequency of GFP+ cells in the tumor and spleen. E) The percentage of CD8+GFP+ cells expressing exhaustion markers Tim-3 and Lag-3. F) IFN-γ levels in tumor tissue measured by ELISA of tumor homogenate. G) Protein levels of CXCL9 in the tumor and serum. H) Frequency of CD8+ T cells in the tumor and spleen. I) Frequency of CD45+ cells, CD19+ cells, and NK1.1+ cells in the tumor and spleen. Values and error bars represent mean ± s.e.m. * p ≤ 0.05, ** p ≤ 0.01, *** p≤ 0.001 A–C) One-way ANOVA with Tukey’s Multiple Comparison Test at each concentration; n=3 experimental replicates or n=5 for D–I.

