
Figure 2.
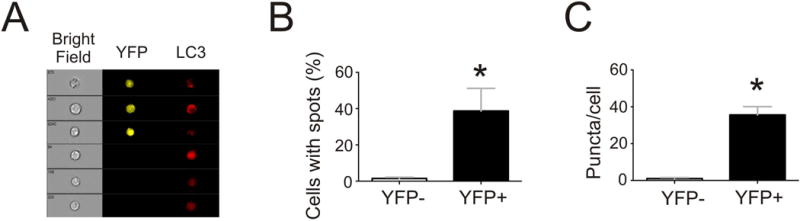
Quantification of Autophagy in Memory B Cells. A. Splenic B cells were isolated from AID-CreERT2-eYFP recipients of BALB/c hearts four months after transplant and analyzed on an AMNIS imaging flow cytometer. Representative bright field and fluorescence images from analyzed B cells of YFP+ (top three rows) and YFPneg (bottom three rows) demonstrating punctate versus diffuse LC3 staining in the populations, respectively. B–C. Quantification of the percentage cells containing fluorescent puncta (B) and the number of fluorescent puncta per cell (C) in YFPneg and YFP+ B cells (n=4 separate recipients *p<0.05 YFP+ vs YFPneg).