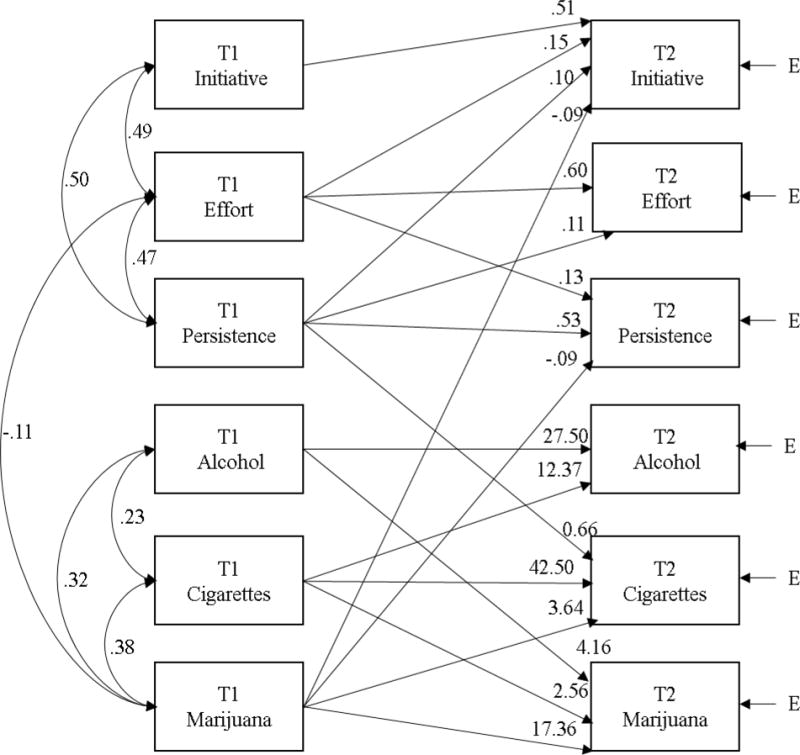
Figure 2.

Cross-lagged panel model. All possible combinations of correlations involving T1 measures, as well as test-retest and cross-lagged paths from T1 to T2, are controlled in the model. For diagrammatic clarity, only significant (p < .05) coefficients are displayed. Coefficients to T2 initiative, effort, and persistence represent (adjusted) beta weights. Coefficients to T2 alcohol, cigarettes, and marijuana represented (adjusted) odds ratios. E = predictive error.
