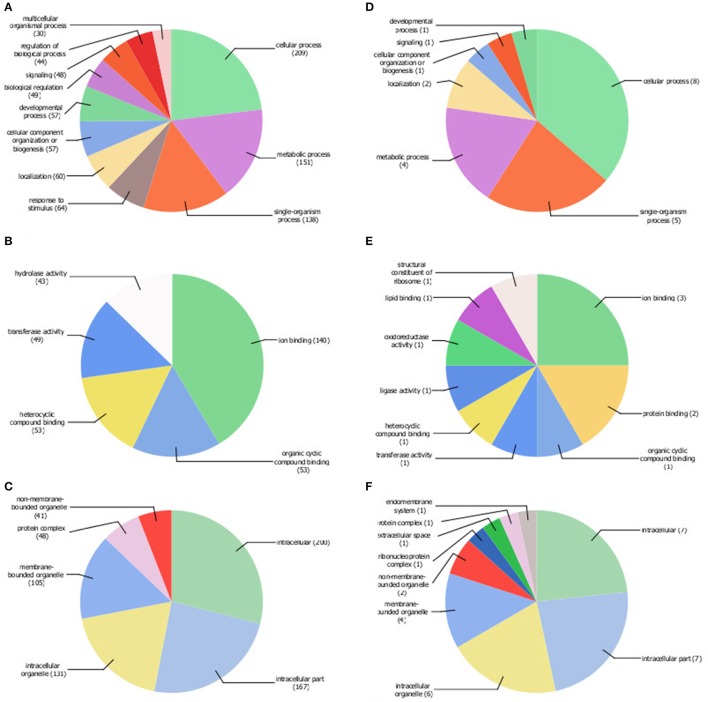
Figure 2.
Gene ontology (GO) terms associated with young (A–C) and old (D–F) erythrocyte age classes. Pie charts were generated at level 2 for biological process (A,D), and level 3 for molecular function (B,E) and cellular component (C,F) by Blast2GO using 742 transcripts with higher levels in young erythrocytes (Table S2; pie charts A–C) and 34 transcripts with higher levels in old erythrocytes (Table 2; pie charts D–F) as input.

