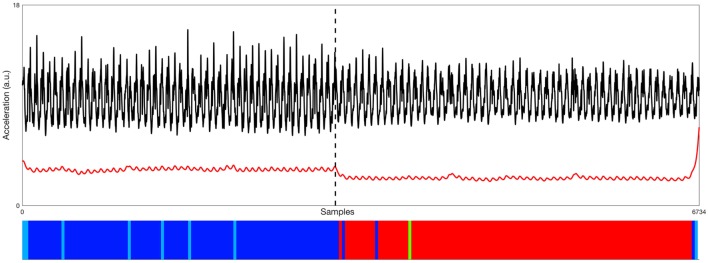
Figure 2.
Representative example of data processed from the accelerometer (black signal—raw vertical acceleration; red signal—low-pass filtered posterior–anterior acceleration) used by one of the six Parkinson’s disease (PD) patients during two 10-m walk trials, first in his OFF state and later in his best ON state. Time series are two collated non-consecutive segments of data recorded OFF (left) and best ON (right) states of one PD patient, as indicated by the black dashed line. Bottom: the distinction between the OFF and ON states is very clear with this methodology, where the clusters’ organization (showed by the color bar) perfectly aligns with the transition of the signals above. Different colors represent found behavioral blocks (same color code as Figure 1B).

