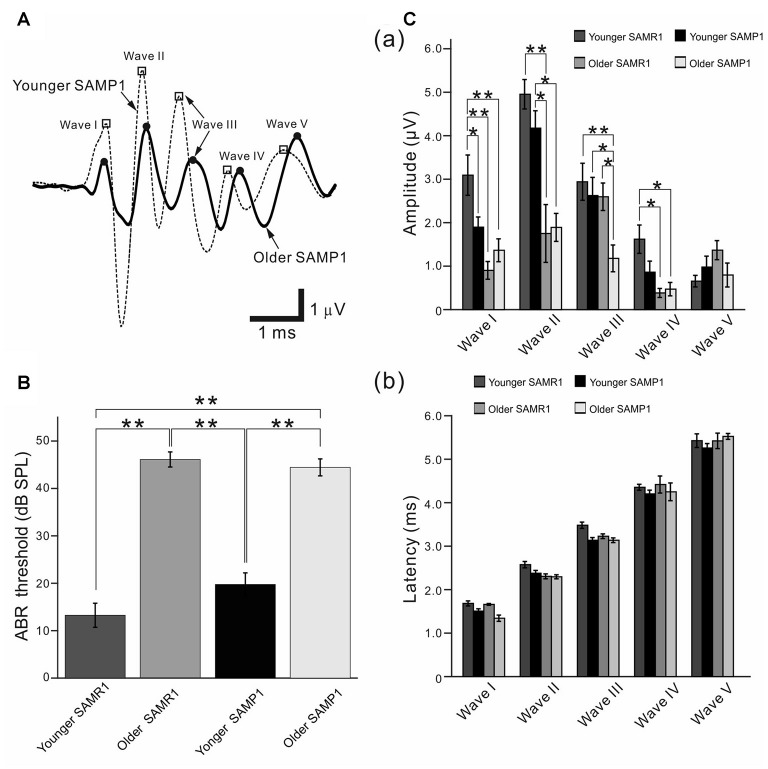
Figure 1.
Auditory brainstem response (ABR) recordings from senescence-accelerated mice (SAM) strains. (A) Typical examples of average ABR waveforms obtained from younger and older SAMP1 mice in response to click sound stimuli. Only the waveforms from representative SAMP1 mice are shown because those obtained from SAMR1 mice were quite similar. The waveforms from the younger and older mouse groups were respectively averaged for over 500 click sound stimuli at 65 dB sound pressure level (SPL; see “Materials and Methods” section). Open squares (□) and filled circles (●) mark the local peaks of ABR waves I to V from left to right. (B) ABR thresholds for the click sound stimuli were compared among the younger and older SAM-R1 and -P1 mice. Asterisks (**) represent P < 0.01 by the Tukey-Kramer multiple comparison test. (C) Local peak amplitudes in (a) and peak latency in (b), which were quantified from the ABR recordings in response to the click stimuli at 65 dB SPL among the four mouse groups. *P < 0.05 and **P < 0.01 by the Tukey-Kramer multiple comparison test.

