Figure 12.
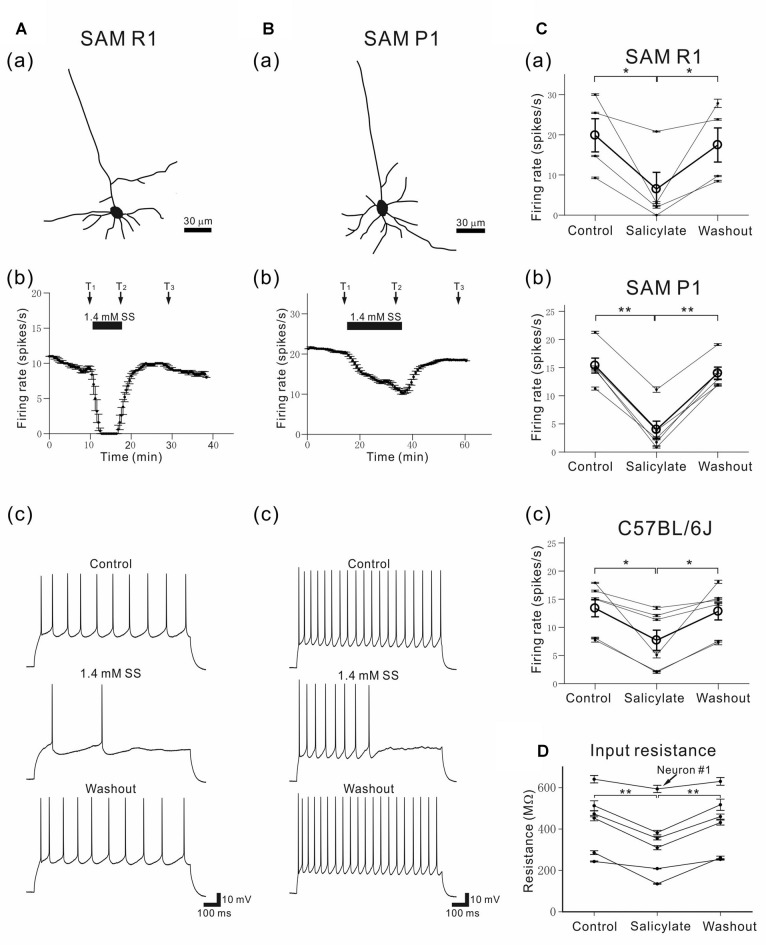
Morphology and characteristic firing of L4 pyramidal AC neurons in young SAM-R1 and -P1 mice. (Aa) A morphological trace of a typical pyramidal neuron from a SAMR1 mouse (see “Materials and Methods” section). (b) The time course of firing rates in the same pyramidal neuron after application of 1.4 mM SS. A horizontal bar indicates the duration of SS application. (c) Action potential trains evoked by a 1-s depolarizing current (150 pA) in a pyramidal neuron before (top panel; at time T1 in the control condition), during (middle panel; at time T2 in the 1.4-mM SS condition), and after (bottom panel; at time T3 in the washout condition) application of SS. (Ba) A morphological trace of a typical pyramidal neuron from a SAMP1 mouse.(b) The time course of firing rates in a pyramidal neuron afterapplication of 1.4 mM SS. Vertical bars represent SEM.(c) Action potential trains evoked by a 1-s depolarizing current (150 pA). (C) Changes in action potential trains evoked by a 1-s depolarizing current (100–150 pA) in a pyramidal neuron before (control), during (1.4-mM SS) and after (washout) application of SS for the three mouse strains: SAMR1 in (a), SAMP1 in (b) and C57BL/6J in (c). For group data, the mean firing rate is represented by open circles and thick lines. Vertical bars represent SEM. *P < 0.05 and **P < 0.01. (D) Membrane input resistance of L4 pyramidal neurons in C57BL/6J mice before (control), during (salicylate) and after (washout) the superfusion of 1.4 mM SS. The input resistance of one neuron (neuron #1) out of six neurons was not significantly different among the three conditions (P > 0.10), and that of other five neurons was significantly different (**P < 0.01) by one way analysis of variance (ANOVA) with the Tukey-Kramer multiple comparison.

