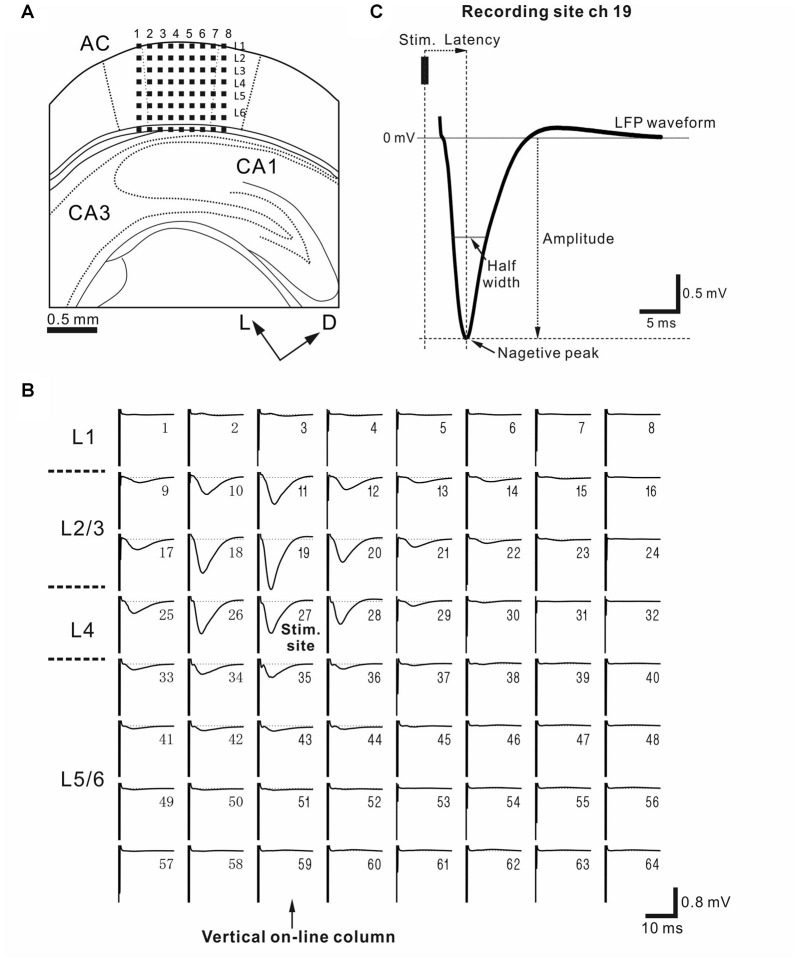
Figure 2.
(A) Schematic diagram of a cortical coronal slice on a multielectrode array (MEA) substrate. Evoked local field potentials (LFPs) were recorded extracellularly from a slice of the mouse auditory cortex (AC) on MEA substrate with 64-channel (ch) electrodes. Small dark squares represent the 64 electrodes. The size of each electrode was 50 × 50 μm2, and the inter-electrode interval was 150 μm. The AC was schematically located according to the standard mouse brain atlas (Franklin and Paxinos, 2008). Dorsal and lateral directions are represented by two arrows labeled D and L, respectively. Each column is identified by a number (1–8) from left to right. (B) Representative LFP waveforms in a coronal AC slice. Each waveform was obtained by averaging 10 trials. A stimulating electrode (ch 27) at the 3rd row from the top and the 3th column from the left was situated in L4 or the border between L4 and L3, and the stimulation site was indicated by “stim. site”. During recording, the stimulation current intensity was 15 μA (see “Materials and Methods” section). The numbers in the upper and right regions of the subplots represent the channel numbers of the 64 electrodes. The onset timing of the stimulus is identified by a large artifact on the left side in each LFP plot. Columns with recording sites vertical to the stimulus site are referred to as vertical “on-line” columns, and are indicated by an arrow. (C) Typical evoked average waveform illustrating the characteristic properties of LFP: peak amplitude, peak latency and half width of the peak of the LFP. The LFP had a small positive peak following a large negative peak. The recording and stimulation sites were chs 19 and 27, respectively.

