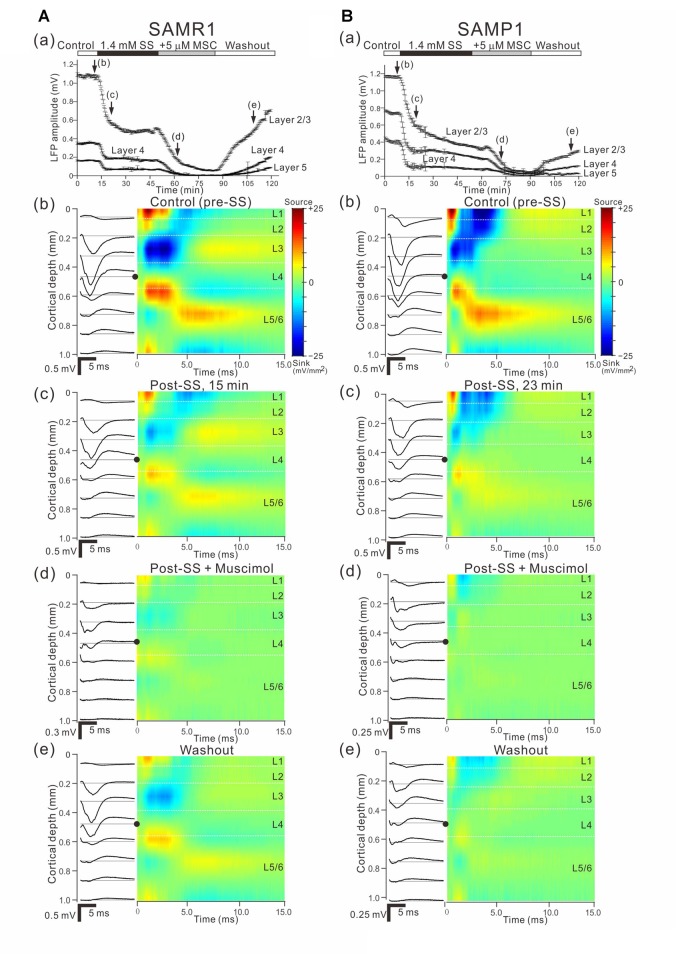
Figure 9.
Effects of individual and simultaneous application of SS and MSC on cortical responses evoked by stimulation at one site in L4. (A) Representative example of an older SAMR1 mouse (13-month old). In (a), following 1.4 mM SS administration (arrow (c)), superfusion of 5-μM MSC further decreased the negative peak amplitude of LFPs (arrow (d)) in the three layers (L2/3, L4 and L5), compared with control (arrow (b)). Durations of the four (control, post-SS, 5-μM MSC and washout) conditions are given in the white, back, gray and white bars on the top, respectively. (b–e) show the LFP (left) and current source density (CSD; right) profiles recorded at time points (b–e) in (a), which respectively correspond to control (pre-SS), post-SS, post-SS plus MSC and washout. In the LFP profiles, the stimulation sites are indicated by black circles. All LFP and CSD values represent the averages over 10 trials. (B) Similarly, representative example of an older SAMP1 mouse (13-month old). As in Part (A), the time courses of peak amplitudes in the three layers are shown in (a), and the LFP (left) and CSD (right) profiles are illustrated under the four conditions in (b–e).

