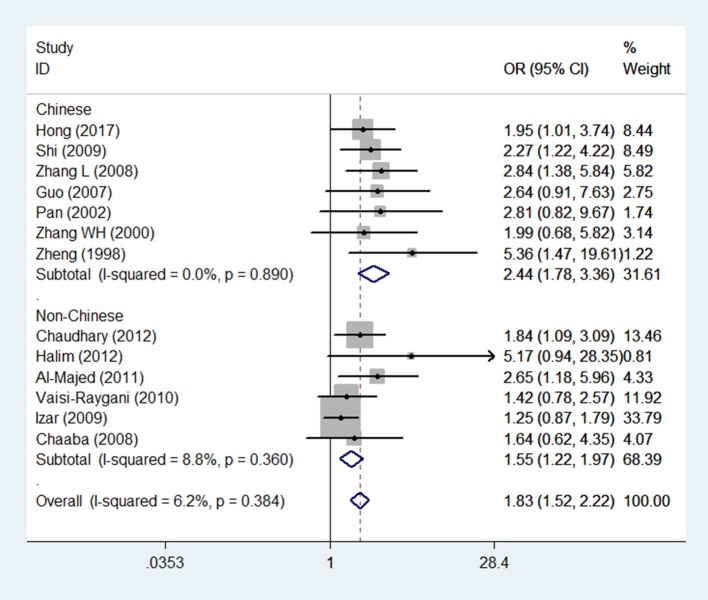
Figure 2.
Forest plot for the association between APOE gene polymorphism and the risk of coronary artery diseases in type 2 diabetes patients under the genetic model of ε4/ε4+ε3/ε4 vs. ε3/ε3. The center of each square represents the OR, the area of the square is for the weight of studies, and the horizontal line indicates the 95% CI.

