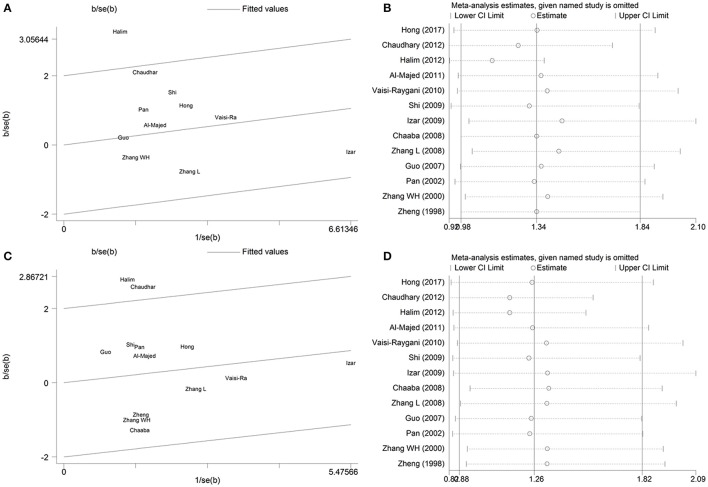
Figure 4.
Galbraith plot analysis and sensitivity analysis of the association between APOE gene polymorphism and the risk of coronary artery diseases in type 2 diabetes patients under the genetic model of ε2 allele vs. ε3 allele (A,B) and ε2/ε2+ε2/ε3 vs. ε3/ε3 (C,D). For sensitivity analysis, open circle indicates the pooled ORs, horizontal lines represent the 95% CIs, given named study is omitted.

