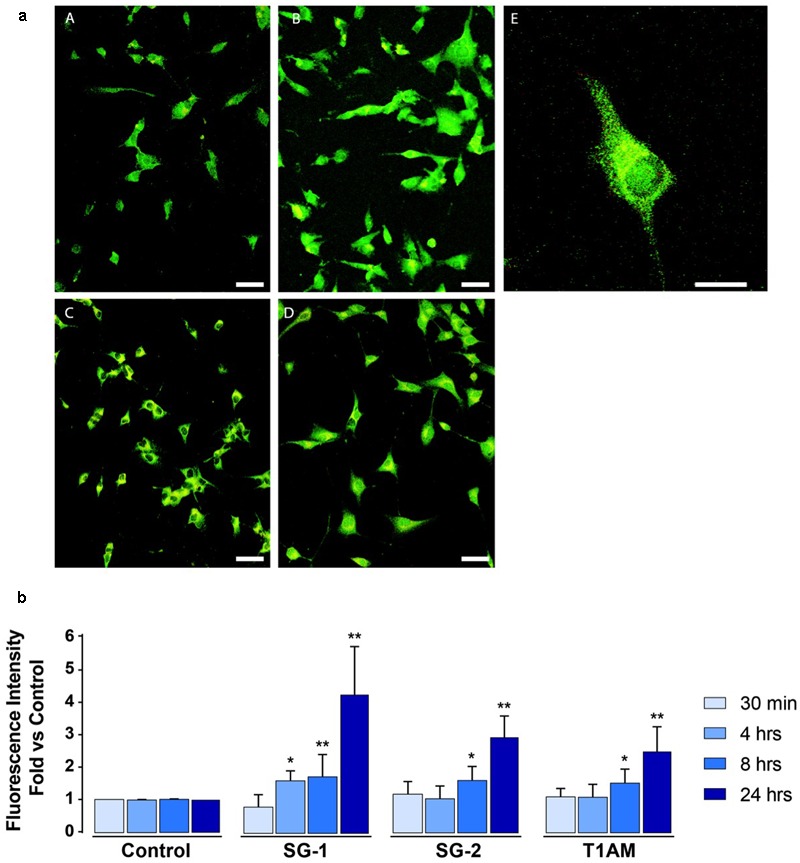
FIGURE 10.

Confocal microscopy confirms induction of autophagy in U-87MG cells treated with 1 μM SG-1, SG-2, or T1AM. (a) Representative images of LC3-expressing cells incubated with 1 μM SG1, SG2 or T1AM 24 h after the treatment. (A) Control cells, (B) SG1-treated cells, (C) SG2-treated cells, (D) T1AM-treated cells. Scale bars are 25 μm. (E) Higher magnification of one SG1-treated cell expressing LC3 proteins. Scale bar is 10 μm. (b) LC3-expression in U-87MG cells treated with 1 μM SG-1, SG-2, or T1AM for 30 min, 4, 8, and 24 h. Data are normalized to the appropriate control values. Statistical analysis performed by student’s t-test. ∗P < 0.05 compared with baseline conditions; ∗∗P < 0.01 compared with baseline conditions.
