
FIGURE 13.
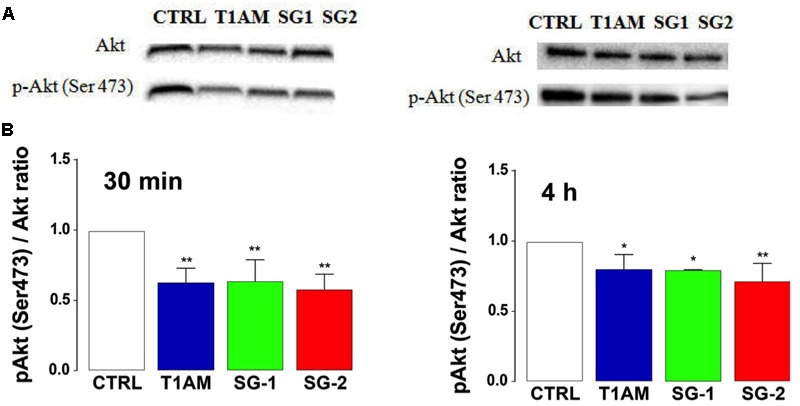
T1AM, SG-1 and SG-2 reduce the phosphorylation levels of Akt-Ser473 in U-87MG cells. (A) Representative bands and (B) Western blot quantification of pAkt/Akt ratio in U-87MG cells after treatment with 1 μM T1AM, SG-1, or SG-2 for 30 min and 4 h. Results represent mean ± SEM of three different gels. ∗P < 0.05, ∗∗P < 0.01, versus vehicle treated cells (Control).