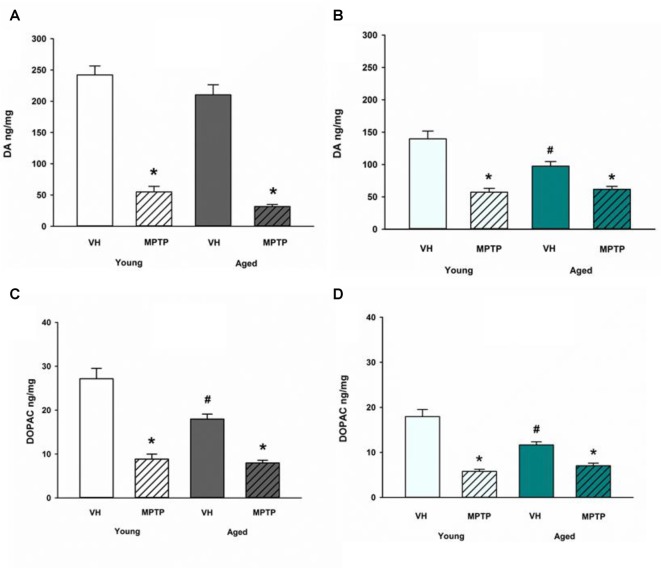
Figure 4.
DA and DOPAC concentrations after MPTP in Young and Aged ST (A,C) and NAc (B,D). Young and aged mice were treated with VH or 20 mg/kg MPTP and sacrificed 24 h later. Brains were sectioned and ST and NAc were collected in tissue buffer for HPLC-ED analysis. DA and DOPAC were measured and normalized to mg protein per sample. Data is expressed as mean + SEM. Data was analyzed via two way ANOVA with post hoc Holm-Sidak test. Asterisk (*) indicates statistically significant difference (p < 0.05) from respective VH control within age group, while hash symbol (#) represents statistically significant difference from Young VH control.

