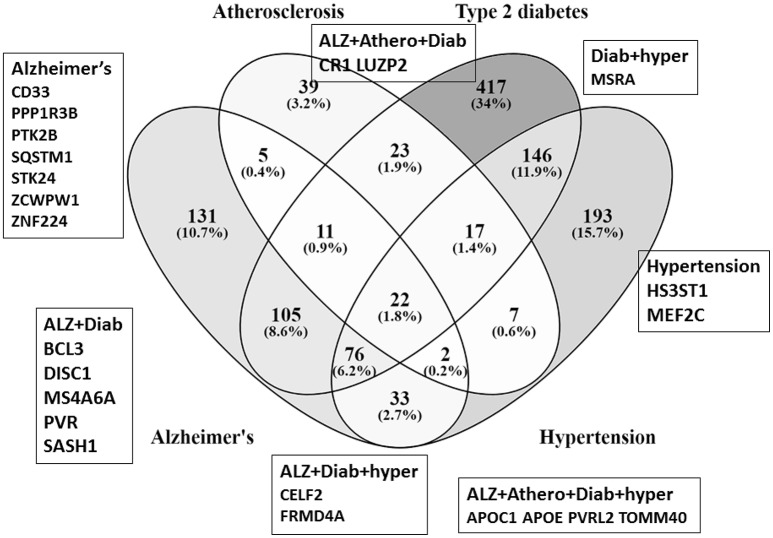
Figure 1.
Venn diagram shows the number of susceptibility genes (GWASdb) and their percentage occurrence within the P. gingivalis/host interactome that are common or specific to various combinations of atherosclerosis (Athero), type 2 diabetes (Diab), hypertension (hyper) and Alzheimer's (Alz), The Venn diagram is for data from GWASdb. The genes in boxes refer to GWAS genes from the more stringent NCBI-EBI data that are also part of the P. gingivalis/host interactome. The percentages are those of the sum of the interactome/susceptibility gene overlaps for all diseases represented in the figure (atherosclerosis+ type 2 diabetes + hypertension+ Alzheimer's gene/interactome overlaps).

