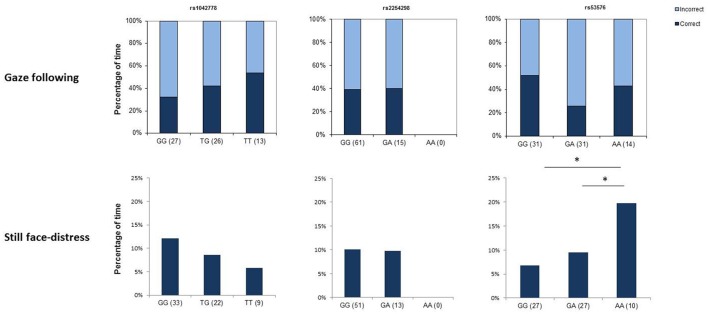
Figure 1.
Genotype × behavior associations in children. The upper row shows associations between genotype at the three selected SNPs and success in using communicative gaze as a cue to locate a hidden object, while the lower row depicts associations with the amount of time spent with showing distress signals in an unpleasant social situation (still face task). Asterisks mark significant gene × behavior correspondences.

